HSBC 2005 Annual Report Download - page 283
Download and view the complete annual report
Please find page 283 of the 2005 HSBC annual report below. You can navigate through the pages in the report by either clicking on the pages listed below, or by using the keyword search tool below to find specific information within the annual report.-
 1
1 -
2
-
3
-
4
-
5
-
6
-
7
-
8
-
9
-
10
-
11
-
12
-
13
-
14
-
15
-
16
-
17
-
18
-
19
-
20
-
21
-
22
-
23
-
24
-
25
-
26
-
27
-
28
-
29
-
30
-
31
-
32
-
33
-
34
-
35
-
36
-
37
-
38
-
39
-
40
-
41
-
42
-
43
-
44
-
45
-
46
-
47
-
48
-
49
-
50
-
51
-
52
-
53
-
54
-
55
-
56
-
57
-
58
-
59
-
60
-
61
-
62
-
63
-
64
-
65
-
66
-
67
-
68
-
69
-
70
-
71
-
72
-
73
-
74
-
75
-
76
-
77
-
78
-
79
-
80
-
81
-
82
-
83
-
84
-
85
-
86
-
87
-
88
-
89
-
90
-
91
-
92
-
93
-
94
-
95
-
96
-
97
-
98
-
99
-
100
-
101
-
102
-
103
-
104
-
105
-
106
-
107
-
108
-
109
-
110
-
111
-
112
-
113
-
114
-
115
-
116
-
117
-
118
-
119
-
120
-
121
-
122
-
123
-
124
-
125
-
126
-
127
-
128
-
129
-
130
-
131
-
132
-
133
-
134
-
135
-
136
-
137
-
138
-
139
-
140
-
141
-
142
-
143
-
144
-
145
-
146
-
147
-
148
-
149
-
150
-
151
-
152
-
153
-
154
-
155
-
156
-
157
-
158
-
159
-
160
-
161
-
162
-
163
-
164
-
165
-
166
-
167
-
168
-
169
-
170
-
171
-
172
-
173
-
174
-
175
-
176
-
177
-
178
-
179
-
180
-
181
-
182
-
183
-
184
-
185
-
186
-
187
-
188
-
189
-
190
-
191
-
192
-
193
-
194
-
195
-
196
-
197
-
198
-
199
-
200
-
201
-
202
-
203
-
204
-
205
-
206
-
207
-
208
-
209
-
210
-
211
-
212
-
213
-
214
-
215
-
216
-
217
-
218
-
219
-
220
-
221
-
222
-
223
-
224
-
225
-
226
-
227
-
228
-
229
-
230
-
231
-
232
-
233
-
234
-
235
-
236
-
237
-
238
-
239
-
240
-
241
-
242
-
243
-
244
-
245
-
246
-
247
-
248
-
249
-
250
-
251
-
252
-
253
-
254
-
255
-
256
-
257
-
258
-
259
-
260
-
261
-
262
-
263
-
264
-
265
-
266
-
267
-
268
-
269
-
270
-
271
-
272
-
 273
273 -
 274
274 -
 275
275 -
 276
276 -
 277
277 -
 278
278 -
 279
279 -
 280
280 -
 281
281 -
 282
282 -
 283
283 -
 284
284 -
 285
285 -
 286
286 -
 287
287 -
 288
288 -
 289
289 -
 290
290 -
 291
291 -
 292
292 -
 293
293 -
294
-
295
-
296
-
297
-
298
-
299
-
300
-
301
-
302
-
303
-
304
-
305
-
306
-
307
-
308
-
309
-
310
-
311
-
312
-
313
-
314
-
315
-
316
-
317
-
318
-
319
-
320
-
321
-
322
-
323
-
324
-
325
-
326
-
327
-
328
-
329
-
330
-
331
-
332
-
333
-
334
-
335
-
336
-
337
-
338
-
339
-
340
-
341
-
342
-
343
-
344
-
345
-
346
-
347
-
348
-
349
-
350
-
351
-
352
-
353
-
354
-
355
-
356
-
357
-
358
-
359
-
360
-
361
-
362
-
363
-
364
-
365
-
366
-
367
-
368
-
369
-
370
-
371
-
372
-
373
-
374
-
375
-
376
-
377
-
378
-
379
-
380
-
381
-
382
-
383
-
384
-
385
-
386
-
387
-
388
-
389
-
390
-
391
-
392
-
393
-
394
-
395
-
396
-
397
-
398
-
399
-
400
-
401
-
402
-
403
-
404
-
405
-
406
-
407
-
408
-
409
-
410
-
411
-
412
-
413
-
414
-
415
-
416
-
417
-
418
-
419
-
420
-
421
-
422
-
423
-
424
 |
 |

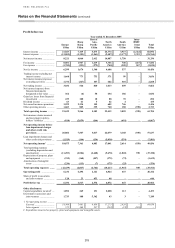
281
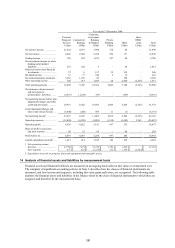
Year ended 31 December 2004
Personal
Financial
Services
Commercial
Banking
Corporate,
Investment
Banking
& Markets
Private
Banking Other
Intra-
HSBC
items Total
US$m US$m US$m US$m US$m US$m US$m
Net interest income .................... 21,422 4,875 3,994 718 90 – 31,099
Net fee income ........................... 6,406 2,645 2,764 962 171 – 12,948
Trading income .......................... 320 234 1,935 257 40 – 2,786
Net investment income on assets
backing policyholders’
liabilities ................................ 635 324 9 – 44 – 1,012
Gains less losses from financial
investments ............................ 79 6 197 39 219 – 540
Dividend income ....................... 16 37 548 5 16 – 622
Net earned insurance premiums . 3,652 1,072 86 – 558 – 5,368
Other operating income ............. 360 513 1,029 24 2,050 (2,363) 1,613
Total operating income .............. 32,890 9,706 10,562 2,005 3,188 (2,363) 55,988
Net insurance claims incurred
and movement in
policyholders’ liabilities ........ (2,953) (1,264) (59) – (359) – (4,635)
Net operating income before loan
impairment charges and other
credit risk provisions ............. 29,937 8,442 10,503 2,005 2,829 (2,363) 51,353
Loan impairment charges and
other credit risk provisions .... (6,500) (200) 499 11 (1) – (6,191)
Net operating income1 ............... 23,437 8,242 11,002 2,016 2,828 (2,363) 45,162
Operating expenses .................... (15,009) (4,220) (5,809) (1,319) (2,493) 2,363 (26,487)
Operating profit ......................... 8,428 4,022 5,193 697 335 – 18,675
Share of profit in associates
and joint ventures .................. 69 35 95 – 69 – 268
Profit before tax ......................... 8,497 4,057 5,288 697 404 – 18,943
Capital expenditure incurred2 .... 1,415 614 1,919 142 538 – 4,628
1Net operating income:
External ................................. 22,760 7,419 12,239 1,704 1,040
–
45,162
Inter-segment ........................ 67
7
823 (1,237) 312 1,788 (2,363)
–
2Expenditure incurred on property, plant and equipment and intangible assets.
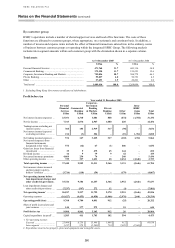
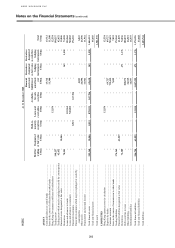
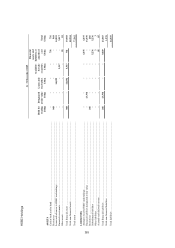
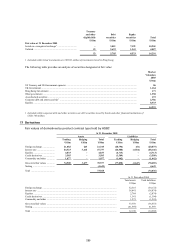
14 Analysis of financial assets and liabilities by measurement basis
Financial assets and financial liabilities are measured on an ongoing basis either at fair value or at amortised cost.
The summary of significant accounting policies in Note 2 describes how the classes of financial instruments are
measured, and how income and expenses, including fair value gains and losses, are recognised. The following table
analyses the financial assets and liabilities in the balance sheet by the class of financial instrument to which they are
assigned, and therefore by the measurement basis: