HSBC 2005 Annual Report Download - page 238
Download and view the complete annual report
Please find page 238 of the 2005 HSBC annual report below. You can navigate through the pages in the report by either clicking on the pages listed below, or by using the keyword search tool below to find specific information within the annual report.-
 1
1 -
2
-
3
-
4
-
5
-
6
-
7
-
8
-
9
-
10
-
11
-
12
-
13
-
14
-
15
-
16
-
17
-
18
-
19
-
20
-
21
-
22
-
23
-
24
-
25
-
26
-
27
-
28
-
29
-
30
-
31
-
32
-
33
-
34
-
35
-
36
-
37
-
38
-
39
-
40
-
41
-
42
-
43
-
44
-
45
-
46
-
47
-
48
-
49
-
50
-
51
-
52
-
53
-
54
-
55
-
56
-
57
-
58
-
59
-
60
-
61
-
62
-
63
-
64
-
65
-
66
-
67
-
68
-
69
-
70
-
71
-
72
-
73
-
74
-
75
-
76
-
77
-
78
-
79
-
80
-
81
-
82
-
83
-
84
-
85
-
86
-
87
-
88
-
89
-
90
-
91
-
92
-
93
-
94
-
95
-
96
-
97
-
98
-
99
-
100
-
101
-
102
-
103
-
104
-
105
-
106
-
107
-
108
-
109
-
110
-
111
-
112
-
113
-
114
-
115
-
116
-
117
-
118
-
119
-
120
-
121
-
122
-
123
-
124
-
125
-
126
-
127
-
128
-
129
-
130
-
131
-
132
-
133
-
134
-
135
-
136
-
137
-
138
-
139
-
140
-
141
-
142
-
143
-
144
-
145
-
146
-
147
-
148
-
149
-
150
-
151
-
152
-
153
-
154
-
155
-
156
-
157
-
158
-
159
-
160
-
161
-
162
-
163
-
164
-
165
-
166
-
167
-
168
-
169
-
170
-
171
-
172
-
173
-
174
-
175
-
176
-
177
-
178
-
179
-
180
-
181
-
182
-
183
-
184
-
185
-
186
-
187
-
188
-
189
-
190
-
191
-
192
-
193
-
194
-
195
-
196
-
197
-
198
-
199
-
200
-
201
-
202
-
203
-
204
-
205
-
206
-
207
-
208
-
209
-
210
-
211
-
212
-
213
-
214
-
215
-
216
-
217
-
218
-
219
-
220
-
221
-
222
-
223
-
224
-
225
-
226
-
227
-
 228
228 -
 229
229 -
 230
230 -
 231
231 -
 232
232 -
 233
233 -
 234
234 -
 235
235 -
 236
236 -
 237
237 -
 238
238 -
 239
239 -
 240
240 -
 241
241 -
 242
242 -
 243
243 -
 244
244 -
 245
245 -
 246
246 -
 247
247 -
 248
248 -
249
-
250
-
251
-
252
-
253
-
254
-
255
-
256
-
257
-
258
-
259
-
260
-
261
-
262
-
263
-
264
-
265
-
266
-
267
-
268
-
269
-
270
-
271
-
272
-
273
-
274
-
275
-
276
-
277
-
278
-
279
-
280
-
281
-
282
-
283
-
284
-
285
-
286
-
287
-
288
-
289
-
290
-
291
-
292
-
293
-
294
-
295
-
296
-
297
-
298
-
299
-
300
-
301
-
302
-
303
-
304
-
305
-
306
-
307
-
308
-
309
-
310
-
311
-
312
-
313
-
314
-
315
-
316
-
317
-
318
-
319
-
320
-
321
-
322
-
323
-
324
-
325
-
326
-
327
-
328
-
329
-
330
-
331
-
332
-
333
-
334
-
335
-
336
-
337
-
338
-
339
-
340
-
341
-
342
-
343
-
344
-
345
-
346
-
347
-
348
-
349
-
350
-
351
-
352
-
353
-
354
-
355
-
356
-
357
-
358
-
359
-
360
-
361
-
362
-
363
-
364
-
365
-
366
-
367
-
368
-
369
-
370
-
371
-
372
-
373
-
374
-
375
-
376
-
377
-
378
-
379
-
380
-
381
-
382
-
383
-
384
-
385
-
386
-
387
-
388
-
389
-
390
-
391
-
392
-
393
-
394
-
395
-
396
-
397
-
398
-
399
-
400
-
401
-
402
-
403
-
404
-
405
-
406
-
407
-
408
-
409
-
410
-
411
-
412
-
413
-
414
-
415
-
416
-
417
-
418
-
419
-
420
-
421
-
422
-
423
-
424
 |
 |

HSBC HOLDINGS PLC
Financial Statements
236
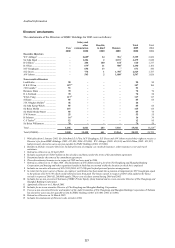
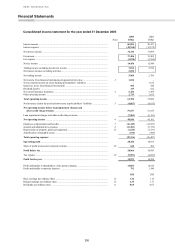
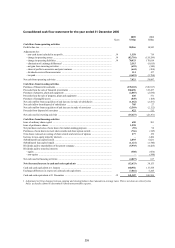
Consolidated income statement for the year ended 31 December 2005
2005 2004
Notes US$m US$m
Interest income ................................................................................................................... 60,094 50,471
Interest expense .................................................................................................................. (28,760) (19,372)
Net interest income ............................................................................................................. 31,334 31,099
Fee income ......................................................................................................................... 17,486 15,902
Fee expense ........................................................................................................................ (3,030) (2,954)
Net fee income ................................................................................................................... 14,456 12,948
Trading income excluding net interest income ................................................................... 3,656 2,786
Net interest income on trading activities ............................................................................. 2,208 –
Net trading income .............................................................................................................5,864 2,786
Net income from financial instruments designated at fair value ......................................... 31,034 –
Net investment income on assets backing policyholders’ liabilities ................................... –1,012
Gains less losses from financial investments ...................................................................... 692 540
Dividend income ................................................................................................................155 622
Net earned insurance premiums .......................................................................................... 45,436 5,368
Other operating income ...................................................................................................... 2,733 1,613
Total operating income .................................................................................................... 61,704 55,988
Net insurance claims incurred and movement in policyholders’ liabilities ......................... 5(4,067) (4,635)
Net operating income before loan impairment charges and
other credit risk provisions ......................................................................................... 57,637 51,353
Loan impairment charges and other credit risk provisions .................................................. (7,801) (6,191)
Net operating income ....................................................................................................... 649,836 45,162
Employee compensation and benefits ................................................................................. 7(16,145) (14,523)
General and administrative expenses .................................................................................. 8(11,183) (9,739)
Depreciation of property, plant and equipment ................................................................... 23 (1,632) (1,731)
Amortisation of intangible assets......................................................................................... (554) (494)
Total operating expenses .................................................................................................. (29,514) (26,487)
Operating profit ................................................................................................................ 20,322 18,675
Share of profit in associates and joint ventures ................................................................... 20 644 268
Profit before tax ................................................................................................................ 20,966 18,943
Tax expense ........................................................................................................................ 10 (5,093) (4,685)
Profit for the year ............................................................................................................. 15,873 14,258
Profit attributable to shareholders of the parent company ................................................... 15,081 12,918
Profit attributable to minority interests ............................................................................... 792 1,340
US$ US$
Basic earnings per ordinary share ....................................................................................... 12 1.36 1.18
Diluted earnings per ordinary share .................................................................................... 12 1.35 1.17
Dividends per ordinary share .............................................................................................. 11 0.69 0.63