HSBC 2005 Annual Report Download - page 113
Download and view the complete annual report
Please find page 113 of the 2005 HSBC annual report below. You can navigate through the pages in the report by either clicking on the pages listed below, or by using the keyword search tool below to find specific information within the annual report.-
 1
1 -
2
-
3
-
4
-
5
-
6
-
7
-
8
-
9
-
10
-
11
-
12
-
13
-
14
-
15
-
16
-
17
-
18
-
19
-
20
-
21
-
22
-
23
-
24
-
25
-
26
-
27
-
28
-
29
-
30
-
31
-
32
-
33
-
34
-
35
-
36
-
37
-
38
-
39
-
40
-
41
-
42
-
43
-
44
-
45
-
46
-
47
-
48
-
49
-
50
-
51
-
52
-
53
-
54
-
55
-
56
-
57
-
58
-
59
-
60
-
61
-
62
-
63
-
64
-
65
-
66
-
67
-
68
-
69
-
70
-
71
-
72
-
73
-
74
-
75
-
76
-
77
-
78
-
79
-
80
-
81
-
82
-
83
-
84
-
85
-
86
-
87
-
88
-
89
-
90
-
91
-
92
-
93
-
94
-
95
-
96
-
97
-
98
-
99
-
100
-
101
-
102
-
 103
103 -
 104
104 -
 105
105 -
 106
106 -
 107
107 -
 108
108 -
 109
109 -
 110
110 -
 111
111 -
 112
112 -
 113
113 -
 114
114 -
 115
115 -
 116
116 -
 117
117 -
 118
118 -
 119
119 -
 120
120 -
 121
121 -
 122
122 -
 123
123 -
124
-
125
-
126
-
127
-
128
-
129
-
130
-
131
-
132
-
133
-
134
-
135
-
136
-
137
-
138
-
139
-
140
-
141
-
142
-
143
-
144
-
145
-
146
-
147
-
148
-
149
-
150
-
151
-
152
-
153
-
154
-
155
-
156
-
157
-
158
-
159
-
160
-
161
-
162
-
163
-
164
-
165
-
166
-
167
-
168
-
169
-
170
-
171
-
172
-
173
-
174
-
175
-
176
-
177
-
178
-
179
-
180
-
181
-
182
-
183
-
184
-
185
-
186
-
187
-
188
-
189
-
190
-
191
-
192
-
193
-
194
-
195
-
196
-
197
-
198
-
199
-
200
-
201
-
202
-
203
-
204
-
205
-
206
-
207
-
208
-
209
-
210
-
211
-
212
-
213
-
214
-
215
-
216
-
217
-
218
-
219
-
220
-
221
-
222
-
223
-
224
-
225
-
226
-
227
-
228
-
229
-
230
-
231
-
232
-
233
-
234
-
235
-
236
-
237
-
238
-
239
-
240
-
241
-
242
-
243
-
244
-
245
-
246
-
247
-
248
-
249
-
250
-
251
-
252
-
253
-
254
-
255
-
256
-
257
-
258
-
259
-
260
-
261
-
262
-
263
-
264
-
265
-
266
-
267
-
268
-
269
-
270
-
271
-
272
-
273
-
274
-
275
-
276
-
277
-
278
-
279
-
280
-
281
-
282
-
283
-
284
-
285
-
286
-
287
-
288
-
289
-
290
-
291
-
292
-
293
-
294
-
295
-
296
-
297
-
298
-
299
-
300
-
301
-
302
-
303
-
304
-
305
-
306
-
307
-
308
-
309
-
310
-
311
-
312
-
313
-
314
-
315
-
316
-
317
-
318
-
319
-
320
-
321
-
322
-
323
-
324
-
325
-
326
-
327
-
328
-
329
-
330
-
331
-
332
-
333
-
334
-
335
-
336
-
337
-
338
-
339
-
340
-
341
-
342
-
343
-
344
-
345
-
346
-
347
-
348
-
349
-
350
-
351
-
352
-
353
-
354
-
355
-
356
-
357
-
358
-
359
-
360
-
361
-
362
-
363
-
364
-
365
-
366
-
367
-
368
-
369
-
370
-
371
-
372
-
373
-
374
-
375
-
376
-
377
-
378
-
379
-
380
-
381
-
382
-
383
-
384
-
385
-
386
-
387
-
388
-
389
-
390
-
391
-
392
-
393
-
394
-
395
-
396
-
397
-
398
-
399
-
400
-
401
-
402
-
403
-
404
-
405
-
406
-
407
-
408
-
409
-
410
-
411
-
412
-
413
-
414
-
415
-
416
-
417
-
418
-
419
-
420
-
421
-
422
-
423
-
424
 |
 |

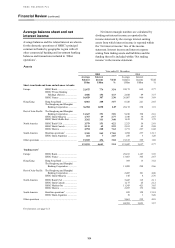
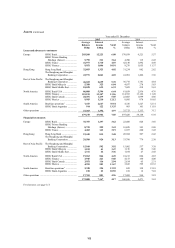
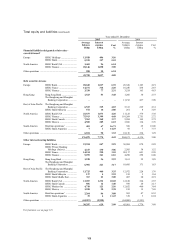
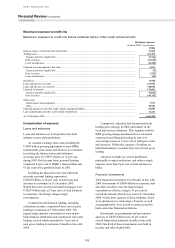
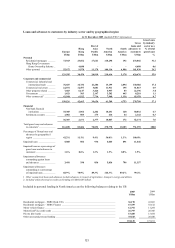
111
Analysis of changes in net interest
income
The following table allocates changes in net interest
income between volume and rate for 2005 compared
with 2004. Changes due to a combination of volume
and rate, and the effect of reclassifying items on the
adoption of IAS 32 and IAS 39 at 1 January 2005,
are allocated to rate.
Interest income
2005 compared with 2004
Increase/(decrease)
2005 Volume Rate 2004
US$m US$m US$m US$m
Short-term funds and loans and advances to banks
Europe HSBC Bank .............................................................. 774
(
64
)
169 669
HSBC Private Banking Holdings (Suisse) ................ 156 32 35 89
HSBC France ........................................................... 387
(
339
)
(
234
)
960
Hong Kong Hang Seng Bank ....................................................... 288
(
7
)
74 221
The Hongkong and Shanghai Banking
Corporation .......................................................... 1,058 167 353 538
Rest of Asia-Pacific The Hongkong and Shanghai Banking
Corporation .......................................................... 351 54 99 198
HSBC Bank Malaysia ............................................... 49 11 2 36
HSBC Bank Middle East .......................................... 111 29 53 29
North America HSBC Bank USA ..................................................... 151 30 65 56
HSBC Bank Canada ................................................. 62
(
1
)
18 45
HSBC Mexico .......................................................... 228
(
47
)
48 227
South America Brazilian operations1 ................................................ 565 164 164 237
HSBC Bank Argentina ............................................. 7–4 3
Other operations ........................................................................................... 456 (76) 203 329
4,643
(
5
)
1,011 3,637
Tradin
g
assets .............................................................................................. 3,023
Loans and advances to customers
Europe HSBC Bank .............................................................. 12,223 1,817 885 9,521
HSBC Private Banking Holdings (Suisse) ................ 211 27 69 115
HSBC France ........................................................... 1,710
(
8
)
(
174
)
1,892
HSBC Finance .......................................................... 1,086 77
(
46
)
1,055
Hong Kong Hang Seng Bank ....................................................... 1,323 47 394 882
The Hongkong and Shanghai Banking
Corporation .......................................................... 2,061 70 585 1,406
Rest of Asia-Pacific The Hongkong and Shanghai Banking
Corporation .......................................................... 2,659 478 400 1,781
HSBC Bank Malaysia ............................................... 325 25 22 278
HSBC Bank Middle East .......................................... 635 147 70 418
North America HSBC Bank USA ..................................................... 5,594 1,197 1,461 2,936
HSBC Finance .......................................................... 13,307 439
(
278
)
13,146
HSBC Bank Canada ................................................. 1,439 286 54 1,099
HSBC Mexico .......................................................... 1,210 205 127 878
South America Brazilian operations1 ................................................ 2,647 879 241 1,527
HSBC Bank Argentina ............................................ 122 1 20 101
Other operations ........................................................................................... 1,352
(
266
)
505 1,113
47,904 5,230 4,526 38,148
For footnotes, see page 113.