HSBC 2005 Annual Report Download - page 392
Download and view the complete annual report
Please find page 392 of the 2005 HSBC annual report below. You can navigate through the pages in the report by either clicking on the pages listed below, or by using the keyword search tool below to find specific information within the annual report.-
 1
1 -
2
-
3
-
4
-
5
-
6
-
7
-
8
-
9
-
10
-
11
-
12
-
13
-
14
-
15
-
16
-
17
-
18
-
19
-
20
-
21
-
22
-
23
-
24
-
25
-
26
-
27
-
28
-
29
-
30
-
31
-
32
-
33
-
34
-
35
-
36
-
37
-
38
-
39
-
40
-
41
-
42
-
43
-
44
-
45
-
46
-
47
-
48
-
49
-
50
-
51
-
52
-
53
-
54
-
55
-
56
-
57
-
58
-
59
-
60
-
61
-
62
-
63
-
64
-
65
-
66
-
67
-
68
-
69
-
70
-
71
-
72
-
73
-
74
-
75
-
76
-
77
-
78
-
79
-
80
-
81
-
82
-
83
-
84
-
85
-
86
-
87
-
88
-
89
-
90
-
91
-
92
-
93
-
94
-
95
-
96
-
97
-
98
-
99
-
100
-
101
-
102
-
103
-
104
-
105
-
106
-
107
-
108
-
109
-
110
-
111
-
112
-
113
-
114
-
115
-
116
-
117
-
118
-
119
-
120
-
121
-
122
-
123
-
124
-
125
-
126
-
127
-
128
-
129
-
130
-
131
-
132
-
133
-
134
-
135
-
136
-
137
-
138
-
139
-
140
-
141
-
142
-
143
-
144
-
145
-
146
-
147
-
148
-
149
-
150
-
151
-
152
-
153
-
154
-
155
-
156
-
157
-
158
-
159
-
160
-
161
-
162
-
163
-
164
-
165
-
166
-
167
-
168
-
169
-
170
-
171
-
172
-
173
-
174
-
175
-
176
-
177
-
178
-
179
-
180
-
181
-
182
-
183
-
184
-
185
-
186
-
187
-
188
-
189
-
190
-
191
-
192
-
193
-
194
-
195
-
196
-
197
-
198
-
199
-
200
-
201
-
202
-
203
-
204
-
205
-
206
-
207
-
208
-
209
-
210
-
211
-
212
-
213
-
214
-
215
-
216
-
217
-
218
-
219
-
220
-
221
-
222
-
223
-
224
-
225
-
226
-
227
-
228
-
229
-
230
-
231
-
232
-
233
-
234
-
235
-
236
-
237
-
238
-
239
-
240
-
241
-
242
-
243
-
244
-
245
-
246
-
247
-
248
-
249
-
250
-
251
-
252
-
253
-
254
-
255
-
256
-
257
-
258
-
259
-
260
-
261
-
262
-
263
-
264
-
265
-
266
-
267
-
268
-
269
-
270
-
271
-
272
-
273
-
274
-
275
-
276
-
277
-
278
-
279
-
280
-
281
-
282
-
283
-
284
-
285
-
286
-
287
-
288
-
289
-
290
-
291
-
292
-
293
-
294
-
295
-
296
-
297
-
298
-
299
-
300
-
301
-
302
-
303
-
304
-
305
-
306
-
307
-
308
-
309
-
310
-
311
-
312
-
313
-
314
-
315
-
316
-
317
-
318
-
319
-
320
-
321
-
322
-
323
-
324
-
325
-
326
-
327
-
328
-
329
-
330
-
331
-
332
-
333
-
334
-
335
-
336
-
337
-
338
-
339
-
340
-
341
-
342
-
343
-
344
-
345
-
346
-
347
-
348
-
349
-
350
-
351
-
352
-
353
-
354
-
355
-
356
-
357
-
358
-
359
-
360
-
361
-
362
-
363
-
364
-
365
-
366
-
367
-
368
-
369
-
370
-
371
-
372
-
373
-
374
-
375
-
376
-
377
-
378
-
379
-
380
-
381
-
 382
382 -
 383
383 -
 384
384 -
 385
385 -
 386
386 -
 387
387 -
 388
388 -
 389
389 -
 390
390 -
 391
391 -
 392
392 -
 393
393 -
 394
394 -
 395
395 -
 396
396 -
 397
397 -
 398
398 -
 399
399 -
 400
400 -
 401
401 -
 402
402 -
403
-
404
-
405
-
406
-
407
-
408
-
409
-
410
-
411
-
412
-
413
-
414
-
415
-
416
-
417
-
418
-
419
-
420
-
421
-
422
-
423
-
424
 |
 |

HSBC HOLDINGS PLC
Notes on the Financial Statements (continued)
390
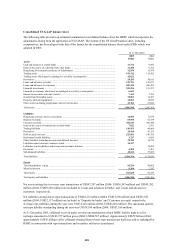
HSBC also enters into stock lending and borrowing transactions by which either cash or other securities may be
received in exchange for stock. At 31 December 2005, stock borrowing transactions where the securities borrowed
were subject to sale or repledge amounted to US$25,783 million (2004: US$28,354 million).
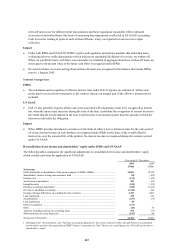
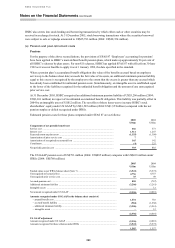
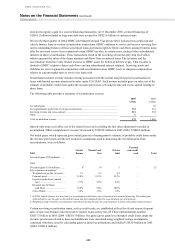
(a) Pension and post-retirement costs
Pensions
For the purpose of the above reconciliations, the provisions of SFAS 87 ‘Employers’ accounting for pensions’
have been applied to HSBC’s main defined benefit pension plans, which make up approximately 96 per cent of
all HSBC’s schemes by plan assets. For non-US schemes, HSBC has applied SFAS 87 with effect from 30 June
1992 as it was not feasible to apply it as at 1 January 1989, the date specified in the standard.
When a pension plan’s accumulated benefit obligation (the value of the benefits accrued based on employee
service up to the balance sheet date) exceeds the fair value of its assets, an additional minimum pension liability
equal to this excess is recognised by the employer to the extent that the excess is greater than any accrual which
has already been established for unfunded pension costs. Simultaneously, an intangible asset is established equal
to the lower of the liability recognised for the unfunded benefit obligation and the amount of any unrecognised
prior service cost.
At 31 December 2005, HSBC recognised an additional minimum pension liability of US$3,206 million (2004:
US$3,261 million) in respect of its unfunded accumulated benefit obligation. This liability was partially offset in
2004 by an intangible asset of US$12 million. The net effect of these items was to increase HSBC’s total
shareholders’ equity under US GAAP by US$1,585 million (2004: US$1,557million) compared with the net
pension surplus or deficit recognised under IFRSs.
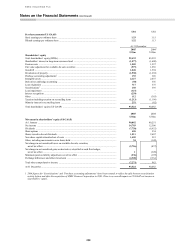
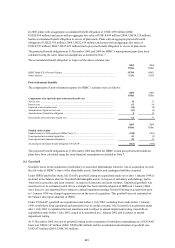
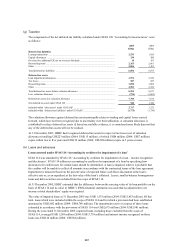
Estimated pension costs for these plans computed under SFAS 87 are as follows:
2005 2004
US$m US$m
Components of net periodic benefit cost
Service cost ...................................................................................................................... 666 573
Interest cost ...................................................................................................................... 1,314 1,247
Expected return on plan assets .......................................................................................... (1,355) (1,309)
Amortisation of prior service cost .................................................................................... 77
Amortisation of recognised net actuarial loss ................................................................... 165 142
Curtailment ....................................................................................................................... (4) 225
Net periodic pension cost ................................................................................................. 793 885
The US GAAP pension cost of US$793 million (2004: US$885 million) compares with US$618 million under
IFRSs (2004: US$760 million).
2005 2004
US$m US$m
Funded status as per IFRSs balance sheet (Note 7) ............................................................... (3,941) (5,573)
Unrecognised net actuarial loss ............................................................................................. 4,756 4,757
Unrecognised prior service cost ............................................................................................. 35 49
Accrued pension cost ............................................................................................................. 850 (767)
Additional minimum liability ................................................................................................ (3,206) (3,261)
Intangible assets .................................................................................................................... –12
Net amount recognised under US GAAP .............................................................................. (2,356) (4,016)
Amounts recognised under US GAAP in the balance sheet consist of:
– prepaid benefit cost ........................................................................................................ 1,434 783
– accrued benefit liability ................................................................................................. (584) (1,550)
– additional minimum liability .......................................................................................... (3,206) (3,261)
– intangible assets ............................................................................................................. –12
(2,356) (4,016)
US GAAP adjustment
Amount recognised under US GAAP .................................................................................... (2,356) (4,016)
Amounts recognised for these schemes under IFRSs ............................................................ (3,941) (5,573)
1,585 1,557