HSBC 2005 Annual Report Download - page 291
Download and view the complete annual report
Please find page 291 of the 2005 HSBC annual report below. You can navigate through the pages in the report by either clicking on the pages listed below, or by using the keyword search tool below to find specific information within the annual report.-
 1
1 -
2
-
3
-
4
-
5
-
6
-
7
-
8
-
9
-
10
-
11
-
12
-
13
-
14
-
15
-
16
-
17
-
18
-
19
-
20
-
21
-
22
-
23
-
24
-
25
-
26
-
27
-
28
-
29
-
30
-
31
-
32
-
33
-
34
-
35
-
36
-
37
-
38
-
39
-
40
-
41
-
42
-
43
-
44
-
45
-
46
-
47
-
48
-
49
-
50
-
51
-
52
-
53
-
54
-
55
-
56
-
57
-
58
-
59
-
60
-
61
-
62
-
63
-
64
-
65
-
66
-
67
-
68
-
69
-
70
-
71
-
72
-
73
-
74
-
75
-
76
-
77
-
78
-
79
-
80
-
81
-
82
-
83
-
84
-
85
-
86
-
87
-
88
-
89
-
90
-
91
-
92
-
93
-
94
-
95
-
96
-
97
-
98
-
99
-
100
-
101
-
102
-
103
-
104
-
105
-
106
-
107
-
108
-
109
-
110
-
111
-
112
-
113
-
114
-
115
-
116
-
117
-
118
-
119
-
120
-
121
-
122
-
123
-
124
-
125
-
126
-
127
-
128
-
129
-
130
-
131
-
132
-
133
-
134
-
135
-
136
-
137
-
138
-
139
-
140
-
141
-
142
-
143
-
144
-
145
-
146
-
147
-
148
-
149
-
150
-
151
-
152
-
153
-
154
-
155
-
156
-
157
-
158
-
159
-
160
-
161
-
162
-
163
-
164
-
165
-
166
-
167
-
168
-
169
-
170
-
171
-
172
-
173
-
174
-
175
-
176
-
177
-
178
-
179
-
180
-
181
-
182
-
183
-
184
-
185
-
186
-
187
-
188
-
189
-
190
-
191
-
192
-
193
-
194
-
195
-
196
-
197
-
198
-
199
-
200
-
201
-
202
-
203
-
204
-
205
-
206
-
207
-
208
-
209
-
210
-
211
-
212
-
213
-
214
-
215
-
216
-
217
-
218
-
219
-
220
-
221
-
222
-
223
-
224
-
225
-
226
-
227
-
228
-
229
-
230
-
231
-
232
-
233
-
234
-
235
-
236
-
237
-
238
-
239
-
240
-
241
-
242
-
243
-
244
-
245
-
246
-
247
-
248
-
249
-
250
-
251
-
252
-
253
-
254
-
255
-
256
-
257
-
258
-
259
-
260
-
261
-
262
-
263
-
264
-
265
-
266
-
267
-
268
-
269
-
270
-
271
-
272
-
273
-
274
-
275
-
276
-
277
-
278
-
279
-
280
-
 281
281 -
 282
282 -
 283
283 -
 284
284 -
 285
285 -
 286
286 -
 287
287 -
 288
288 -
 289
289 -
 290
290 -
 291
291 -
 292
292 -
 293
293 -
 294
294 -
 295
295 -
 296
296 -
 297
297 -
 298
298 -
 299
299 -
 300
300 -
 301
301 -
302
-
303
-
304
-
305
-
306
-
307
-
308
-
309
-
310
-
311
-
312
-
313
-
314
-
315
-
316
-
317
-
318
-
319
-
320
-
321
-
322
-
323
-
324
-
325
-
326
-
327
-
328
-
329
-
330
-
331
-
332
-
333
-
334
-
335
-
336
-
337
-
338
-
339
-
340
-
341
-
342
-
343
-
344
-
345
-
346
-
347
-
348
-
349
-
350
-
351
-
352
-
353
-
354
-
355
-
356
-
357
-
358
-
359
-
360
-
361
-
362
-
363
-
364
-
365
-
366
-
367
-
368
-
369
-
370
-
371
-
372
-
373
-
374
-
375
-
376
-
377
-
378
-
379
-
380
-
381
-
382
-
383
-
384
-
385
-
386
-
387
-
388
-
389
-
390
-
391
-
392
-
393
-
394
-
395
-
396
-
397
-
398
-
399
-
400
-
401
-
402
-
403
-
404
-
405
-
406
-
407
-
408
-
409
-
410
-
411
-
412
-
413
-
414
-
415
-
416
-
417
-
418
-
419
-
420
-
421
-
422
-
423
-
424
 |
 |

289
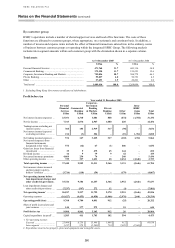
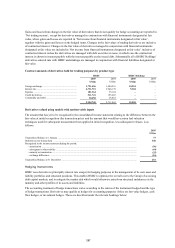
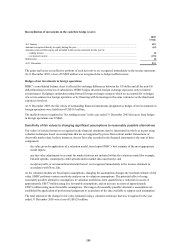
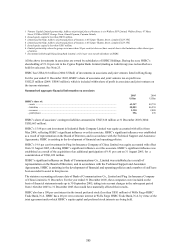
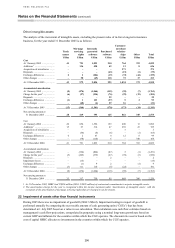
Reconciliation of movements in the cash flow hedge reserve
2005
US$m
At 1 January ..................................................................................................................................................................... 410
Amounts recognised directly in equity during the year .................................................................................................... (63)
Amounts removed from equity and included in the income statement for the year in:
– trading income .......................................................................................................................................................... (5)
– net interest income ................................................................................................................................................... (101)
Deferred tax ..................................................................................................................................................................... (8)
At 31 December ............................................................................................................................................................... 233
The gains and losses on ineffective portions of such derivatives are recognised immediately in the income statement.
At 31 December 2005, a loss of US$96 million was recognised due to hedge ineffectiveness.
Hedges of net investments in foreign operations
HSBC’s consolidated balance sheet is affected by exchange differences between the US dollar and all the non-US
dollar functional currencies of subsidiaries. HSBC hedges structural foreign exchange exposures only in limited
circumstances. Hedging is undertaken using forward foreign exchange contracts which are accounted for as hedges
of a net investment in a foreign operation, or by financing with borrowings in the same currencies as the functional
currencies involved.
At 31 December 2005, the fair values of outstanding financial instruments designated as hedges of net investments in
foreign operations were liabilities of US$114 million.
The ineffectiveness recognised in ‘Net trading income’ in the year ended 31 December 2005 that arose from hedges
in foreign operations was US$nil.
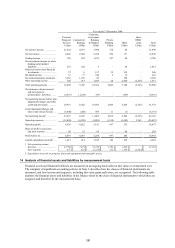
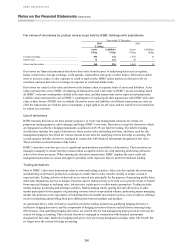
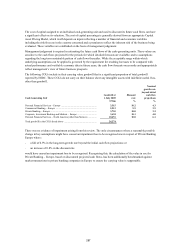
Sensitivity of fair values to changing significant assumptions to reasonably possible alternatives
Fair values of certain derivatives recognised in the financial statements may be determined in whole or in part using
valuation techniques based on assumptions that are not supported by prices from current market transactions or
observable market data. In these instances, the net fair value recorded in the financial statements is the sum of three
components:
– the value given by application of a valuation model, based upon HSBC’s best estimate of the most appropriate
model inputs;
– any fair value adjustments to account for market features not included within the valuation model (for example,
bid-mid spreads, counterparty credit spreads and/or market data uncertainty); and
– inception profit, or an unamortised element thereof, not recognised immediately in the income statement in
accordance with Note 2(k).
As the valuation models are based upon assumptions, changing the assumptions changes the resultant estimate of fair
value. HSBC performs various sensitivity analyses on its valuation assumptions. The potential effect of using
reasonably possible alternative assumptions in valuation models has been quantified as a reduction in assets of
approximately US$77 million using less favourable assumptions, and an increase in assets of approximately
US$73 million using more favourable assumptions. The ranges of reasonably possible alternative assumptions are
established by application of professional judgement to an analysis of the data available to support each assumption.
The total amount of the change in fair value estimated using a valuation technique that was recognised in the year
ended 31 December 2005 was a loss of US$129 million.