HSBC 2005 Annual Report Download - page 136
Download and view the complete annual report
Please find page 136 of the 2005 HSBC annual report below. You can navigate through the pages in the report by either clicking on the pages listed below, or by using the keyword search tool below to find specific information within the annual report.-
 1
1 -
2
-
3
-
4
-
5
-
6
-
7
-
8
-
9
-
10
-
11
-
12
-
13
-
14
-
15
-
16
-
17
-
18
-
19
-
20
-
21
-
22
-
23
-
24
-
25
-
26
-
27
-
28
-
29
-
30
-
31
-
32
-
33
-
34
-
35
-
36
-
37
-
38
-
39
-
40
-
41
-
42
-
43
-
44
-
45
-
46
-
47
-
48
-
49
-
50
-
51
-
52
-
53
-
54
-
55
-
56
-
57
-
58
-
59
-
60
-
61
-
62
-
63
-
64
-
65
-
66
-
67
-
68
-
69
-
70
-
71
-
72
-
73
-
74
-
75
-
76
-
77
-
78
-
79
-
80
-
81
-
82
-
83
-
84
-
85
-
86
-
87
-
88
-
89
-
90
-
91
-
92
-
93
-
94
-
95
-
96
-
97
-
98
-
99
-
100
-
101
-
102
-
103
-
104
-
105
-
106
-
107
-
108
-
109
-
110
-
111
-
112
-
113
-
114
-
115
-
116
-
117
-
118
-
119
-
120
-
121
-
122
-
123
-
124
-
125
-
 126
126 -
 127
127 -
 128
128 -
 129
129 -
 130
130 -
 131
131 -
 132
132 -
 133
133 -
 134
134 -
 135
135 -
 136
136 -
 137
137 -
 138
138 -
 139
139 -
 140
140 -
 141
141 -
 142
142 -
 143
143 -
 144
144 -
 145
145 -
 146
146 -
147
-
148
-
149
-
150
-
151
-
152
-
153
-
154
-
155
-
156
-
157
-
158
-
159
-
160
-
161
-
162
-
163
-
164
-
165
-
166
-
167
-
168
-
169
-
170
-
171
-
172
-
173
-
174
-
175
-
176
-
177
-
178
-
179
-
180
-
181
-
182
-
183
-
184
-
185
-
186
-
187
-
188
-
189
-
190
-
191
-
192
-
193
-
194
-
195
-
196
-
197
-
198
-
199
-
200
-
201
-
202
-
203
-
204
-
205
-
206
-
207
-
208
-
209
-
210
-
211
-
212
-
213
-
214
-
215
-
216
-
217
-
218
-
219
-
220
-
221
-
222
-
223
-
224
-
225
-
226
-
227
-
228
-
229
-
230
-
231
-
232
-
233
-
234
-
235
-
236
-
237
-
238
-
239
-
240
-
241
-
242
-
243
-
244
-
245
-
246
-
247
-
248
-
249
-
250
-
251
-
252
-
253
-
254
-
255
-
256
-
257
-
258
-
259
-
260
-
261
-
262
-
263
-
264
-
265
-
266
-
267
-
268
-
269
-
270
-
271
-
272
-
273
-
274
-
275
-
276
-
277
-
278
-
279
-
280
-
281
-
282
-
283
-
284
-
285
-
286
-
287
-
288
-
289
-
290
-
291
-
292
-
293
-
294
-
295
-
296
-
297
-
298
-
299
-
300
-
301
-
302
-
303
-
304
-
305
-
306
-
307
-
308
-
309
-
310
-
311
-
312
-
313
-
314
-
315
-
316
-
317
-
318
-
319
-
320
-
321
-
322
-
323
-
324
-
325
-
326
-
327
-
328
-
329
-
330
-
331
-
332
-
333
-
334
-
335
-
336
-
337
-
338
-
339
-
340
-
341
-
342
-
343
-
344
-
345
-
346
-
347
-
348
-
349
-
350
-
351
-
352
-
353
-
354
-
355
-
356
-
357
-
358
-
359
-
360
-
361
-
362
-
363
-
364
-
365
-
366
-
367
-
368
-
369
-
370
-
371
-
372
-
373
-
374
-
375
-
376
-
377
-
378
-
379
-
380
-
381
-
382
-
383
-
384
-
385
-
386
-
387
-
388
-
389
-
390
-
391
-
392
-
393
-
394
-
395
-
396
-
397
-
398
-
399
-
400
-
401
-
402
-
403
-
404
-
405
-
406
-
407
-
408
-
409
-
410
-
411
-
412
-
413
-
414
-
415
-
416
-
417
-
418
-
419
-
420
-
421
-
422
-
423
-
424
 |
 |

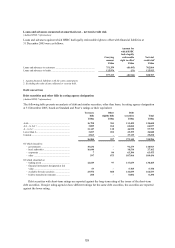
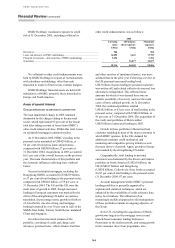
HSBC HOLDINGS PLC
Financial Review (continued)
134
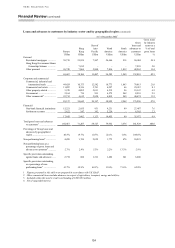
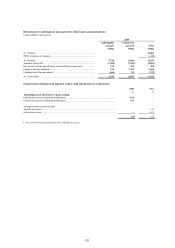
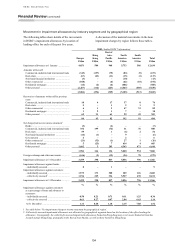
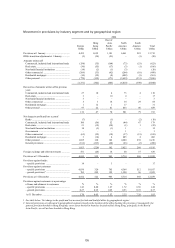
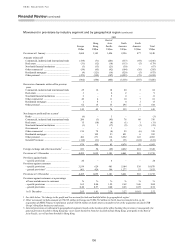
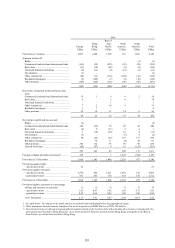
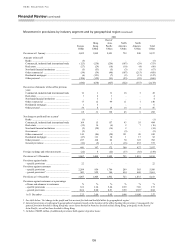
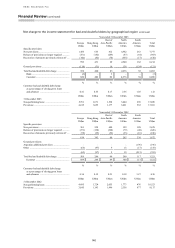
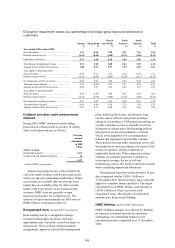
Movement in impairment allowances by industry segment and by geographical region
The following tables show details of the movements
in HSBC’s impairment allowances by location of
lending office for each of the past five years.
A discussion of the material movements in the loan
impairment charges by region follows these tables.
2005 (Audited IFRS 7 information)
Europe
Hong
Kong
Rest of
Asia-
Pacific
North
America
South
America Total
US$m US$m US$m US$m US$m US$m
Impairment allowances at 1 January ................... 4,851 504 960 5,733 586 12,634
Amounts written off
Commercial, industrial and international trade (345) (157) (79) (83) (9) (673)
Real estate ....................................................... (67) (23) (11) (15) (1) (117)
Non-bank financial institutions ....................... (3) – – (10) – (13)
Other commercial ........................................... (108) – (6) (62) (18) (194)
Residential mortgages ..................................... (14) (2) (6) (486) – (508)
Other personal ................................................. (2,267) (112) (227) (4,447) (485) (7,538)
(2,804) (294) (329) (5,103) (513) (9,043)
Recoveries of amounts written off in previous
years
Commercial, industrial and international trade 10 41737 876
Real estate ....................................................... 5–1219
Other commercial ........................................... 612473389
Residential mortgages ..................................... 1917–18
Other personal ................................................. 62 31 61 99 49 302
84 45 82 192 91 494
Net charge/(release) to income statement1
Banks .............................................................. (5) – (2) – – (7)
Commercial, industrial and international trade 354 199 (72) 31 76 588
Real estate ....................................................... 59–1(6)256
Non-bank financial institutions ....................... (14) (1) – 9 – (6)
Governments ................................................... 4––2–6
Other commercial ........................................... (21) (32) (1) 27 1 (26)
Residential mortgages ..................................... 5 (25) 7 614 4 605
Other personal ................................................. 1,602 5 203 4,363 471 6,644
1,984 146 136 5,040 554 7,860
Foreign exchange and other movements ............. (616) (3) (12) (26) 78 (579)
Impairment allowances at 31 December ............. 3,499 398 837 5,836 796 11,366
Impairment allowances against banks:
– individually assessed .................................... 8–1––9
Impairment allowances against customers:
– individually assessed .................................... 1,575 173 500 309 126 2,683
– collectively assessed2 ................................... 1,916 225 336 5,527 670 8,674
Impairment allowances at 31 December ............. 3,499 398 837 5,836 796 11,366
%%%%%%
Impairment allowances against customers
as a percentage of loans and advances to
customers:
– individually assessed .................................... 0.50 0.21 0.71 0.11 1.25 0.36
– collectively assessed .................................... 0.61 0.27 0.47 2.04 6.63 1.16
At 31 December ............................................. 1.11 0.48 1.18 2.15 7.88 1.52
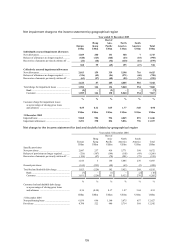
1See table below ‘Net impairment charge to income statement by geographical region’.
2Collectively assessed impairment allowances are allocated to geographical segments based on the location of the office booking the
allowance. Consequently, the collectively assessed impairment allowances booked in Hong Kong may cover assets booked in branches
located outside Hong Kong, principally in the Rest of Asia-Pacific, as well as those booked in Hong Kong.