HSBC 2005 Annual Report Download - page 140
Download and view the complete annual report
Please find page 140 of the 2005 HSBC annual report below. You can navigate through the pages in the report by either clicking on the pages listed below, or by using the keyword search tool below to find specific information within the annual report.-
 1
1 -
2
-
3
-
4
-
5
-
6
-
7
-
8
-
9
-
10
-
11
-
12
-
13
-
14
-
15
-
16
-
17
-
18
-
19
-
20
-
21
-
22
-
23
-
24
-
25
-
26
-
27
-
28
-
29
-
30
-
31
-
32
-
33
-
34
-
35
-
36
-
37
-
38
-
39
-
40
-
41
-
42
-
43
-
44
-
45
-
46
-
47
-
48
-
49
-
50
-
51
-
52
-
53
-
54
-
55
-
56
-
57
-
58
-
59
-
60
-
61
-
62
-
63
-
64
-
65
-
66
-
67
-
68
-
69
-
70
-
71
-
72
-
73
-
74
-
75
-
76
-
77
-
78
-
79
-
80
-
81
-
82
-
83
-
84
-
85
-
86
-
87
-
88
-
89
-
90
-
91
-
92
-
93
-
94
-
95
-
96
-
97
-
98
-
99
-
100
-
101
-
102
-
103
-
104
-
105
-
106
-
107
-
108
-
109
-
110
-
111
-
112
-
113
-
114
-
115
-
116
-
117
-
118
-
119
-
120
-
121
-
122
-
123
-
124
-
125
-
126
-
127
-
128
-
129
-
 130
130 -
 131
131 -
 132
132 -
 133
133 -
 134
134 -
 135
135 -
 136
136 -
 137
137 -
 138
138 -
 139
139 -
 140
140 -
 141
141 -
 142
142 -
 143
143 -
 144
144 -
 145
145 -
 146
146 -
 147
147 -
 148
148 -
 149
149 -
 150
150 -
151
-
152
-
153
-
154
-
155
-
156
-
157
-
158
-
159
-
160
-
161
-
162
-
163
-
164
-
165
-
166
-
167
-
168
-
169
-
170
-
171
-
172
-
173
-
174
-
175
-
176
-
177
-
178
-
179
-
180
-
181
-
182
-
183
-
184
-
185
-
186
-
187
-
188
-
189
-
190
-
191
-
192
-
193
-
194
-
195
-
196
-
197
-
198
-
199
-
200
-
201
-
202
-
203
-
204
-
205
-
206
-
207
-
208
-
209
-
210
-
211
-
212
-
213
-
214
-
215
-
216
-
217
-
218
-
219
-
220
-
221
-
222
-
223
-
224
-
225
-
226
-
227
-
228
-
229
-
230
-
231
-
232
-
233
-
234
-
235
-
236
-
237
-
238
-
239
-
240
-
241
-
242
-
243
-
244
-
245
-
246
-
247
-
248
-
249
-
250
-
251
-
252
-
253
-
254
-
255
-
256
-
257
-
258
-
259
-
260
-
261
-
262
-
263
-
264
-
265
-
266
-
267
-
268
-
269
-
270
-
271
-
272
-
273
-
274
-
275
-
276
-
277
-
278
-
279
-
280
-
281
-
282
-
283
-
284
-
285
-
286
-
287
-
288
-
289
-
290
-
291
-
292
-
293
-
294
-
295
-
296
-
297
-
298
-
299
-
300
-
301
-
302
-
303
-
304
-
305
-
306
-
307
-
308
-
309
-
310
-
311
-
312
-
313
-
314
-
315
-
316
-
317
-
318
-
319
-
320
-
321
-
322
-
323
-
324
-
325
-
326
-
327
-
328
-
329
-
330
-
331
-
332
-
333
-
334
-
335
-
336
-
337
-
338
-
339
-
340
-
341
-
342
-
343
-
344
-
345
-
346
-
347
-
348
-
349
-
350
-
351
-
352
-
353
-
354
-
355
-
356
-
357
-
358
-
359
-
360
-
361
-
362
-
363
-
364
-
365
-
366
-
367
-
368
-
369
-
370
-
371
-
372
-
373
-
374
-
375
-
376
-
377
-
378
-
379
-
380
-
381
-
382
-
383
-
384
-
385
-
386
-
387
-
388
-
389
-
390
-
391
-
392
-
393
-
394
-
395
-
396
-
397
-
398
-
399
-
400
-
401
-
402
-
403
-
404
-
405
-
406
-
407
-
408
-
409
-
410
-
411
-
412
-
413
-
414
-
415
-
416
-
417
-
418
-
419
-
420
-
421
-
422
-
423
-
424
 |
 |

HSBC HOLDINGS PLC
Financial Review (continued)
138
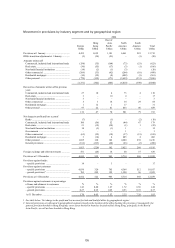
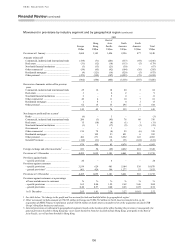
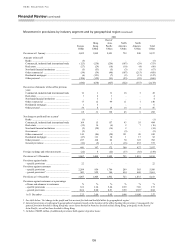
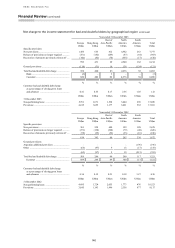
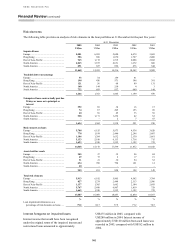
Movement in provisions by industry segment and by geographical region (continued)
2001
Europe
Hong
Kong
Rest of
Asia-
Pacific
North
America
South
America Total
US$m US$m US$m US$m US$m US$m
Provisions at 1 January ....................................... 3,025 1,802 2,091 739 540 8,197
Amounts written off
Banks .............................................................. (5) ––––
(5)
Commercial, industrial and international trade (123) (238) (256) (107) (29) (753)
Real estate ....................................................... (27) (29) (18) (10) (4) (88)
Non-bank financial institutions ....................... (5) (53) (5) (3) (1) (67)
Other commercial ........................................... (54) (34) (48) (107) (215) (458)
Residential mortgages ..................................... (4) (121) (7) (2) (13) (147)
Other personal ................................................. (224) (155) (93) (93) (95) (660)
(442) (630) (427) (322) (357) (2,178)
Recoveries of amounts written off in previous
years
Commercial, industrial and international trade 12 1 11 18 3 45
Real estate ....................................................... 1 2 1 ––4
Non-bank financial institutions ....................... –31––4
Other commercial ........................................... 17 12 99 11 1 140
Residential mortgages ..................................... 1 5 –––6
Other personal ................................................. 34 8 26 14 4 86
65 31 138 43 8 285
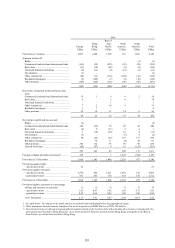
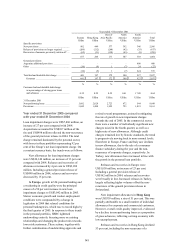
Net charge to profit and loss account1
Banks .............................................................. (1) ––––
(1)
Commercial, industrial and international trade 164 15 157 93 55 484
Real estate ....................................................... (35) 16 (6) 2 7 (16)
Non-bank financial institutions ....................... (2) (20) (14) 2 –(34)
Government .................................................... (2) ––
(3) –(5)
Other commercial ........................................... 143 (84) (58) 151 90 242
Residential mortgages ..................................... (47) 111 10 1 17 92
Other personal ................................................. 257 168 82 70 125 702
General provisions .......................................... (36) (9) 1 (16) 633 573
441 197 172 300 927 2,037
Foreign exchange and other movements ............. (22) 8 (22) (37) (85) (158)
Provisions at 31 December ................................. 3,067 1,408 1,952 723 1,033 8,183
Provisions against banks:
– specific provisions ....................................... 22 ––––
22
Provisions against customers
– specific provisions ....................................... 2,204 856 1,786 289 365 5,500
– general provisions2 ....................................... 841 552 166 434 668 2,661
Provisions at 31 December ................................. 3,067 1,408 1,952 723 1,033 8,183
Provisions against customers as a percentage
of loans and advances to customers %%%%%%
– specific provisions ....................................... 1.61 1.24 5.44 0.39 7.03 1.73
– general provisions ........................................ 0.62 0.80 0.51 0.59 12.8730.84
At 31 December ............................................. 2.23 2.04 5.95 0.98 19.90 2.57
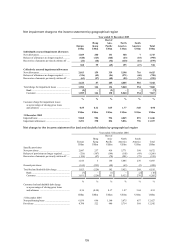
1See table below ‘Net charge to the profit and loss account for bad and doubtful debts by geographical region’.
2General provisions are allocated to geographical segments based on the location of the office booking the provision. Consequently, the
general provision booked in Hong Kong may cover assets booked in branches located outside Hong Kong, principally in the Rest of
Asia-Pacific, as well as those booked in Hong Kong.
3Includes US$600 million of additional provisions held against Argentine loans.