HSBC 2005 Annual Report Download - page 420
Download and view the complete annual report
Please find page 420 of the 2005 HSBC annual report below. You can navigate through the pages in the report by either clicking on the pages listed below, or by using the keyword search tool below to find specific information within the annual report.-
 1
1 -
2
-
3
-
4
-
5
-
6
-
7
-
8
-
9
-
10
-
11
-
12
-
13
-
14
-
15
-
16
-
17
-
18
-
19
-
20
-
21
-
22
-
23
-
24
-
25
-
26
-
27
-
28
-
29
-
30
-
31
-
32
-
33
-
34
-
35
-
36
-
37
-
38
-
39
-
40
-
41
-
42
-
43
-
44
-
45
-
46
-
47
-
48
-
49
-
50
-
51
-
52
-
53
-
54
-
55
-
56
-
57
-
58
-
59
-
60
-
61
-
62
-
63
-
64
-
65
-
66
-
67
-
68
-
69
-
70
-
71
-
72
-
73
-
74
-
75
-
76
-
77
-
78
-
79
-
80
-
81
-
82
-
83
-
84
-
85
-
86
-
87
-
88
-
89
-
90
-
91
-
92
-
93
-
94
-
95
-
96
-
97
-
98
-
99
-
100
-
101
-
102
-
103
-
104
-
105
-
106
-
107
-
108
-
109
-
110
-
111
-
112
-
113
-
114
-
115
-
116
-
117
-
118
-
119
-
120
-
121
-
122
-
123
-
124
-
125
-
126
-
127
-
128
-
129
-
130
-
131
-
132
-
133
-
134
-
135
-
136
-
137
-
138
-
139
-
140
-
141
-
142
-
143
-
144
-
145
-
146
-
147
-
148
-
149
-
150
-
151
-
152
-
153
-
154
-
155
-
156
-
157
-
158
-
159
-
160
-
161
-
162
-
163
-
164
-
165
-
166
-
167
-
168
-
169
-
170
-
171
-
172
-
173
-
174
-
175
-
176
-
177
-
178
-
179
-
180
-
181
-
182
-
183
-
184
-
185
-
186
-
187
-
188
-
189
-
190
-
191
-
192
-
193
-
194
-
195
-
196
-
197
-
198
-
199
-
200
-
201
-
202
-
203
-
204
-
205
-
206
-
207
-
208
-
209
-
210
-
211
-
212
-
213
-
214
-
215
-
216
-
217
-
218
-
219
-
220
-
221
-
222
-
223
-
224
-
225
-
226
-
227
-
228
-
229
-
230
-
231
-
232
-
233
-
234
-
235
-
236
-
237
-
238
-
239
-
240
-
241
-
242
-
243
-
244
-
245
-
246
-
247
-
248
-
249
-
250
-
251
-
252
-
253
-
254
-
255
-
256
-
257
-
258
-
259
-
260
-
261
-
262
-
263
-
264
-
265
-
266
-
267
-
268
-
269
-
270
-
271
-
272
-
273
-
274
-
275
-
276
-
277
-
278
-
279
-
280
-
281
-
282
-
283
-
284
-
285
-
286
-
287
-
288
-
289
-
290
-
291
-
292
-
293
-
294
-
295
-
296
-
297
-
298
-
299
-
300
-
301
-
302
-
303
-
304
-
305
-
306
-
307
-
308
-
309
-
310
-
311
-
312
-
313
-
314
-
315
-
316
-
317
-
318
-
319
-
320
-
321
-
322
-
323
-
324
-
325
-
326
-
327
-
328
-
329
-
330
-
331
-
332
-
333
-
334
-
335
-
336
-
337
-
338
-
339
-
340
-
341
-
342
-
343
-
344
-
345
-
346
-
347
-
348
-
349
-
350
-
351
-
352
-
353
-
354
-
355
-
356
-
357
-
358
-
359
-
360
-
361
-
362
-
363
-
364
-
365
-
366
-
367
-
368
-
369
-
370
-
371
-
372
-
373
-
374
-
375
-
376
-
377
-
378
-
379
-
380
-
381
-
382
-
383
-
384
-
385
-
386
-
387
-
388
-
389
-
390
-
391
-
392
-
393
-
394
-
395
-
396
-
397
-
398
-
399
-
400
-
401
-
402
-
403
-
404
-
405
-
406
-
407
-
408
-
409
-
 410
410 -
 411
411 -
 412
412 -
 413
413 -
 414
414 -
 415
415 -
 416
416 -
 417
417 -
 418
418 -
 419
419 -
 420
420 -
 421
421 -
 422
422 -
 423
423 -
 424
424
 |
 |

HSBC HOLDINGS PLC
lndex (continued)
418
Financial investments 290, 382
Financial liabilities designated at fair value 304
Financial risk management 210
Five-year comparison 3
Fixed assets (intangible) 294
Foreign exchange exposures 316, 395
Funds under management 42
Gains less losses from financial investments 34
Geographical regions 15
Goodwill
and intangible assets 294
impairment 101
IFRSs/US GAAP differences 377, 391
Governance 20, 206
HSBC Holdings/New York Stock Exchange
corporate governance differences 206
Group Managing Directors 186
Health and safety 210
Hong Kong
competitive environment 17
economic background 67
profit/(loss) 66, 71
regulation and supervision 21
HSBC Holdings plc
balance sheet 240
cash flow 242
credit risk 143
employee compensation and benefits 268
history and development 7
information 409
liquidity and funding management 151
statement of changes in total equity 241
structural foreign exchange exposures 159
Impairment assessment 130
Impairment allowances 132
collectively assessed 131
movement by industry and geographical
region 134
Impairment charge to income statement 38, 139
Impairment of assets other than financial
instruments 296
Income from financial instruments (net) 33
Income statement
by geographical region 55
consolidated 26, 236
Insurance
claims incurred (net) and movements in
policyholders’ liabilities 37, 259
liabilities under contracts issued 306
net earned premiums 35, 258
risk management 162
Intangible assets
IFRSs/US GAAP differences 377, 392
Interest income (net) 28
average balance sheet 104
Interest recognition
IFRSs/US GAAP differences 387
Internal control 208
International Financial Reporting Standards
US GAAP comparison / differences 103, 375
transition 332
Investment securities
IFRSs/US GAAP differences 395
Investor relations 409
Lease commitments 328
Legal proceedings 25, (litigation) 330
Liabilities
other 306
subordinated 309
Liquidity and funding management 150
Loans and advances
by industry sector 119
impairment 38, 99, 146
maturity and interest sensitivity 178
IFRSs/US GAAP differences 384, 397
Loan impairment charges 38
IFRSs/US GAAP differences 386
Management Board (Group) 203
Market risk management 152
Maturity analysis of assets and liabilities 315
Memorandum and Articles of Association 406
Minority interests 318
Nomination committee 203
North America
competitive environment 18
economic background 83
profit/(loss) 82, 90
regulation and supervision 22
Off-balance sheet arrangements 182
Operating income (net) 259
Operating income (other) 36
Operating expenses 39
Operational risk management 161
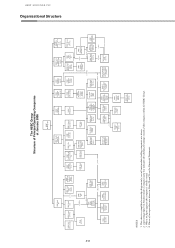
Organisational structure chart 412
Outlook 8
Own shares held
IFRSs/US GAAP differences 384
Pensions
for directors 228
IFRSs/US GAAP differences 376, 390
Personal Financial Services
business highlights 46
performance in Europe 58
performance in Hong Kong 67
performance in Rest of Asia-Pacific 75
performance in North America 84
performance in South America 94
product offering 11
Principal activities and business review 189
Private Banking
business highlights 52
performance in Europe 62
performance in Hong Kong 70
performance in Rest of Asia-Pacific 78
performance in North America 89
performance in South America 96
product offering 14
Profit before tax
by customer group 11, 44, 64, 71, 80, 90, 97,
280
by geographical region 15, 56, 66, 73, 82, 92,
278
Property, plant and equipment 25, 298
IFRSs/US GAAP differences 377