HSBC 2005 Annual Report Download - page 32
Download and view the complete annual report
Please find page 32 of the 2005 HSBC annual report below. You can navigate through the pages in the report by either clicking on the pages listed below, or by using the keyword search tool below to find specific information within the annual report.-
 1
1 -
2
-
3
-
4
-
5
-
6
-
7
-
8
-
9
-
10
-
11
-
12
-
13
-
14
-
15
-
16
-
17
-
18
-
19
-
20
-
21
-
 22
22 -
 23
23 -
 24
24 -
 25
25 -
 26
26 -
 27
27 -
 28
28 -
 29
29 -
 30
30 -
 31
31 -
 32
32 -
 33
33 -
 34
34 -
 35
35 -
 36
36 -
 37
37 -
 38
38 -
 39
39 -
 40
40 -
 41
41 -
 42
42 -
43
-
44
-
45
-
46
-
47
-
48
-
49
-
50
-
51
-
52
-
53
-
54
-
55
-
56
-
57
-
58
-
59
-
60
-
61
-
62
-
63
-
64
-
65
-
66
-
67
-
68
-
69
-
70
-
71
-
72
-
73
-
74
-
75
-
76
-
77
-
78
-
79
-
80
-
81
-
82
-
83
-
84
-
85
-
86
-
87
-
88
-
89
-
90
-
91
-
92
-
93
-
94
-
95
-
96
-
97
-
98
-
99
-
100
-
101
-
102
-
103
-
104
-
105
-
106
-
107
-
108
-
109
-
110
-
111
-
112
-
113
-
114
-
115
-
116
-
117
-
118
-
119
-
120
-
121
-
122
-
123
-
124
-
125
-
126
-
127
-
128
-
129
-
130
-
131
-
132
-
133
-
134
-
135
-
136
-
137
-
138
-
139
-
140
-
141
-
142
-
143
-
144
-
145
-
146
-
147
-
148
-
149
-
150
-
151
-
152
-
153
-
154
-
155
-
156
-
157
-
158
-
159
-
160
-
161
-
162
-
163
-
164
-
165
-
166
-
167
-
168
-
169
-
170
-
171
-
172
-
173
-
174
-
175
-
176
-
177
-
178
-
179
-
180
-
181
-
182
-
183
-
184
-
185
-
186
-
187
-
188
-
189
-
190
-
191
-
192
-
193
-
194
-
195
-
196
-
197
-
198
-
199
-
200
-
201
-
202
-
203
-
204
-
205
-
206
-
207
-
208
-
209
-
210
-
211
-
212
-
213
-
214
-
215
-
216
-
217
-
218
-
219
-
220
-
221
-
222
-
223
-
224
-
225
-
226
-
227
-
228
-
229
-
230
-
231
-
232
-
233
-
234
-
235
-
236
-
237
-
238
-
239
-
240
-
241
-
242
-
243
-
244
-
245
-
246
-
247
-
248
-
249
-
250
-
251
-
252
-
253
-
254
-
255
-
256
-
257
-
258
-
259
-
260
-
261
-
262
-
263
-
264
-
265
-
266
-
267
-
268
-
269
-
270
-
271
-
272
-
273
-
274
-
275
-
276
-
277
-
278
-
279
-
280
-
281
-
282
-
283
-
284
-
285
-
286
-
287
-
288
-
289
-
290
-
291
-
292
-
293
-
294
-
295
-
296
-
297
-
298
-
299
-
300
-
301
-
302
-
303
-
304
-
305
-
306
-
307
-
308
-
309
-
310
-
311
-
312
-
313
-
314
-
315
-
316
-
317
-
318
-
319
-
320
-
321
-
322
-
323
-
324
-
325
-
326
-
327
-
328
-
329
-
330
-
331
-
332
-
333
-
334
-
335
-
336
-
337
-
338
-
339
-
340
-
341
-
342
-
343
-
344
-
345
-
346
-
347
-
348
-
349
-
350
-
351
-
352
-
353
-
354
-
355
-
356
-
357
-
358
-
359
-
360
-
361
-
362
-
363
-
364
-
365
-
366
-
367
-
368
-
369
-
370
-
371
-
372
-
373
-
374
-
375
-
376
-
377
-
378
-
379
-
380
-
381
-
382
-
383
-
384
-
385
-
386
-
387
-
388
-
389
-
390
-
391
-
392
-
393
-
394
-
395
-
396
-
397
-
398
-
399
-
400
-
401
-
402
-
403
-
404
-
405
-
406
-
407
-
408
-
409
-
410
-
411
-
412
-
413
-
414
-
415
-
416
-
417
-
418
-
419
-
420
-
421
-
422
-
423
-
424
 |
 |

HSBC HOLDINGS PLC
Financial Review (continued)
30
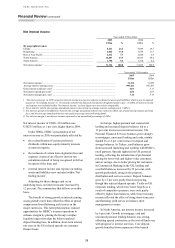
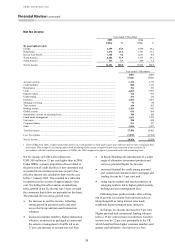
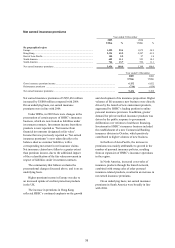
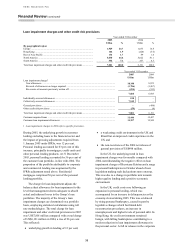
Net fee income
Year ended 31 December
2005 2004
US$m % US$m %
By geographical region
Europe ....................................................................................................... 6,299 43.6 5,980 46.2
Hong Kong ................................................................................................ 1,674 11.6 1,703 13.2
Rest of Asia-Pacific ................................................................................... 1,340 9.2 1,041 8.0
North America ........................................................................................... 4,606 31.9 3,765 29.1
South America ........................................................................................... 537 3.7 459 3.5
Net fee income .......................................................................................... 14,456 100.0 12,948 100.0
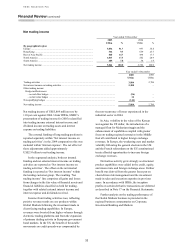
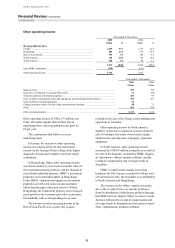
Year ended 31 December
2005
US$m
2004
US$m
Account services ............................................................................................................................. 3,132 2,779
Credit facilities1 .............................................................................................................................. 880 1,179
Remittances .................................................................................................................................... 396 353
Cards .............................................................................................................................................. 4,699 3,987
Imports/exports ............................................................................................................................... 722 692
Underwriting .................................................................................................................................. 274 234
Insurance ........................................................................................................................................ 1,082 1,001
Mortgage servicing ......................................................................................................................... 76 80
Trust income ................................................................................................................................... 199 203
Broking income .............................................................................................................................. 1,104 943
Global custody ................................................................................................................................ 656 564
Maintenance income on operating leases ........................................................................................ 180 190
Funds under management ............................................................................................................... 1,831 1,479
Unit trusts ....................................................................................................................................... 388 498
Corporate finance ........................................................................................................................... 211 193
Other .............................................................................................................................................. 1,656 1,527
Total fee income ............................................................................................................................. 17,486 15,902
Less: fee expense ............................................................................................................................ (3,030) (2,954)
Net fee income ............................................................................................................................... 14,456 12,948
1Under IFRSs from 2005, a higher proportion of fees on credit facilities is dealt with as part of an effective interest rate calculation than
previously. This change in accounting affects both the timing of fee income recognition and its presentation in the accounts. In
accordance with the transition arrangements to IFRSs, the 2004 comparative figure is presented on the old accounting basis.
Net fee income of US$14,456 million was
US$1,508 million or 12 per cent higher than in 2004.
Under IFRSs, a greater proportion of fees related to
the provision of credit facilities is now amortised and
accounted for in net interest income as part of an
effective interest rate calculation than was the case
before 1 January 2005. This resulted in a reduction
in reported net fee income of approximately 4 per
cent. Excluding this effect and on an underlying
basis, growth in net fee income was 14 per cent and
the comments that follow are presented on this basis.
The principal drivers of this growth were:
• the increase in card fee income, reflecting
strong growth in personal credit card sales
across the Group and increased transaction
volumes;
• increased customer numbers, higher transaction
volumes, an increase in packaged accounts and
the selective management of tariffs led to an
11 per cent increase in account services fees;
• in Private Banking, the introduction of a wider
range of alternative investment products and
services generated higher fee income;
• increased demand for credit among personal
and commercial customers drove mortgage and
lending fees up by 11 per cent; and
• rising equity markets and renewed interest in
emerging markets led to higher global custody,
broking and asset management fees.
Offsetting these positive trends, after a strong
run of growth, fee income from unit trust sales in
Hong Kong fell as rising interest rates made
traditional deposit products more attractive.
In Europe, fee income increased by 9 per cent.
Higher personal and commercial lending volumes
led to a 19 per cent increase in credit fees. Card fee
income rose by 22 per cent, principally in the UK
which benefited from higher customer numbers and
greater card utilisation. Account service fees