HSBC 2005 Annual Report Download - page 297
Download and view the complete annual report
Please find page 297 of the 2005 HSBC annual report below. You can navigate through the pages in the report by either clicking on the pages listed below, or by using the keyword search tool below to find specific information within the annual report.-
 1
1 -
2
-
3
-
4
-
5
-
6
-
7
-
8
-
9
-
10
-
11
-
12
-
13
-
14
-
15
-
16
-
17
-
18
-
19
-
20
-
21
-
22
-
23
-
24
-
25
-
26
-
27
-
28
-
29
-
30
-
31
-
32
-
33
-
34
-
35
-
36
-
37
-
38
-
39
-
40
-
41
-
42
-
43
-
44
-
45
-
46
-
47
-
48
-
49
-
50
-
51
-
52
-
53
-
54
-
55
-
56
-
57
-
58
-
59
-
60
-
61
-
62
-
63
-
64
-
65
-
66
-
67
-
68
-
69
-
70
-
71
-
72
-
73
-
74
-
75
-
76
-
77
-
78
-
79
-
80
-
81
-
82
-
83
-
84
-
85
-
86
-
87
-
88
-
89
-
90
-
91
-
92
-
93
-
94
-
95
-
96
-
97
-
98
-
99
-
100
-
101
-
102
-
103
-
104
-
105
-
106
-
107
-
108
-
109
-
110
-
111
-
112
-
113
-
114
-
115
-
116
-
117
-
118
-
119
-
120
-
121
-
122
-
123
-
124
-
125
-
126
-
127
-
128
-
129
-
130
-
131
-
132
-
133
-
134
-
135
-
136
-
137
-
138
-
139
-
140
-
141
-
142
-
143
-
144
-
145
-
146
-
147
-
148
-
149
-
150
-
151
-
152
-
153
-
154
-
155
-
156
-
157
-
158
-
159
-
160
-
161
-
162
-
163
-
164
-
165
-
166
-
167
-
168
-
169
-
170
-
171
-
172
-
173
-
174
-
175
-
176
-
177
-
178
-
179
-
180
-
181
-
182
-
183
-
184
-
185
-
186
-
187
-
188
-
189
-
190
-
191
-
192
-
193
-
194
-
195
-
196
-
197
-
198
-
199
-
200
-
201
-
202
-
203
-
204
-
205
-
206
-
207
-
208
-
209
-
210
-
211
-
212
-
213
-
214
-
215
-
216
-
217
-
218
-
219
-
220
-
221
-
222
-
223
-
224
-
225
-
226
-
227
-
228
-
229
-
230
-
231
-
232
-
233
-
234
-
235
-
236
-
237
-
238
-
239
-
240
-
241
-
242
-
243
-
244
-
245
-
246
-
247
-
248
-
249
-
250
-
251
-
252
-
253
-
254
-
255
-
256
-
257
-
258
-
259
-
260
-
261
-
262
-
263
-
264
-
265
-
266
-
267
-
268
-
269
-
270
-
271
-
272
-
273
-
274
-
275
-
276
-
277
-
278
-
279
-
280
-
281
-
282
-
283
-
284
-
285
-
286
-
 287
287 -
 288
288 -
 289
289 -
 290
290 -
 291
291 -
 292
292 -
 293
293 -
 294
294 -
 295
295 -
 296
296 -
 297
297 -
 298
298 -
 299
299 -
 300
300 -
 301
301 -
 302
302 -
 303
303 -
 304
304 -
 305
305 -
 306
306 -
 307
307 -
308
-
309
-
310
-
311
-
312
-
313
-
314
-
315
-
316
-
317
-
318
-
319
-
320
-
321
-
322
-
323
-
324
-
325
-
326
-
327
-
328
-
329
-
330
-
331
-
332
-
333
-
334
-
335
-
336
-
337
-
338
-
339
-
340
-
341
-
342
-
343
-
344
-
345
-
346
-
347
-
348
-
349
-
350
-
351
-
352
-
353
-
354
-
355
-
356
-
357
-
358
-
359
-
360
-
361
-
362
-
363
-
364
-
365
-
366
-
367
-
368
-
369
-
370
-
371
-
372
-
373
-
374
-
375
-
376
-
377
-
378
-
379
-
380
-
381
-
382
-
383
-
384
-
385
-
386
-
387
-
388
-
389
-
390
-
391
-
392
-
393
-
394
-
395
-
396
-
397
-
398
-
399
-
400
-
401
-
402
-
403
-
404
-
405
-
406
-
407
-
408
-
409
-
410
-
411
-
412
-
413
-
414
-
415
-
416
-
417
-
418
-
419
-
420
-
421
-
422
-
423
-
424
 |
 |

295
Europe Hong Kong
Rest of Asia-
Pacific
North
America
South
America Total
US$m US$m US$m US$m US$m US$m
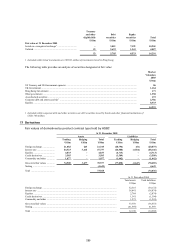
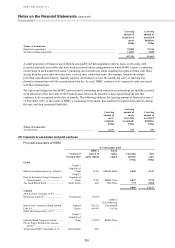
Cost
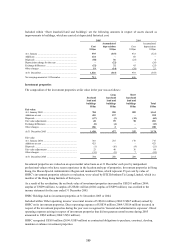
At 1 January 2004 ...................................... 14,655 117 279 12,945 502 28,498
Additions ................................................... 282 2 – 526 61 871
Disposals ................................................... (6) – – – – (6)
Exchange differences ................................. 942 1 5 19 21 988
Other changes ............................................ – – – – 11 11
At 31 December 2004 ................................ 15,873 120 284 13,490 595 30,362
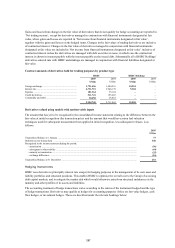
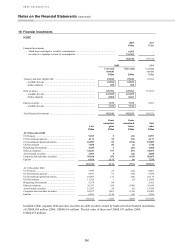
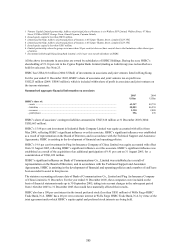
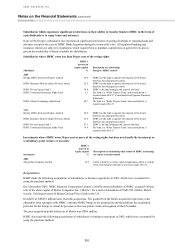
Included within ‘Other operating income’ for the year ended 31 December 2005 is US$23 million (2004: US$nil)
relating to the excess of acquirer’s interest in the net fair value of acquiree’s identifiable assets, liabilities and
contingent liabilities over cost, which was recognised in respect of the acquisition of Allianz Rentas Vitalicias.
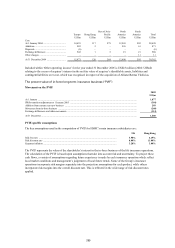
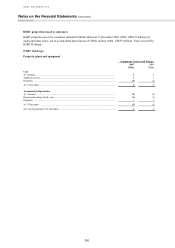
The present value of in-force long-term insurance business (‘PVIF’)
Movement on the PVIF
2005
US$m
At 1 January ..................................................................................................................................................................... 1,877
IFRSs transition adjustment at 1 January 2005 ............................................................................................................... (384)
Addition from current year new business ........................................................................................................................ 289
Movement from in-force business ................................................................................................................................... (268)
Exchange differences and other movements .................................................................................................................... (114)
At 31 December ............................................................................................................................................................... 1,400
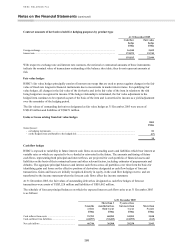
PVIF-specific assumptions
The key assumptions used in the computation of PVIF for HSBC’s main insurance subsidiaries are:
UK Hong Kong
Risk free rate ................................................................................................................................. 3.90% 4.19%
Risk discount rate .......................................................................................................................... 8.00% 11.00%
Expenses inflation .......................................................................................................................... 3.20% 3.00%
The PVIF represents the value of the shareholder’s interest in the in-force business of the life insurance operations.
The calculation of the PVIF is based upon assumptions that take into account risk and uncertainty. To project these
cash flows, a variety of assumptions regarding future experience is made by each insurance operation which reflect
local market conditions and management’s judgement of local future trends. Some of the Group’s insurance
operations incorporate risk margins separately into the projection assumptions for each product, while others
incorporate risk margins into the overall discount rate. This is reflected in the wide range of risk discount rates
applied.