HSBC 2005 Annual Report Download - page 129
Download and view the complete annual report
Please find page 129 of the 2005 HSBC annual report below. You can navigate through the pages in the report by either clicking on the pages listed below, or by using the keyword search tool below to find specific information within the annual report.-
 1
1 -
2
-
3
-
4
-
5
-
6
-
7
-
8
-
9
-
10
-
11
-
12
-
13
-
14
-
15
-
16
-
17
-
18
-
19
-
20
-
21
-
22
-
23
-
24
-
25
-
26
-
27
-
28
-
29
-
30
-
31
-
32
-
33
-
34
-
35
-
36
-
37
-
38
-
39
-
40
-
41
-
42
-
43
-
44
-
45
-
46
-
47
-
48
-
49
-
50
-
51
-
52
-
53
-
54
-
55
-
56
-
57
-
58
-
59
-
60
-
61
-
62
-
63
-
64
-
65
-
66
-
67
-
68
-
69
-
70
-
71
-
72
-
73
-
74
-
75
-
76
-
77
-
78
-
79
-
80
-
81
-
82
-
83
-
84
-
85
-
86
-
87
-
88
-
89
-
90
-
91
-
92
-
93
-
94
-
95
-
96
-
97
-
98
-
99
-
100
-
101
-
102
-
103
-
104
-
105
-
106
-
107
-
108
-
109
-
110
-
111
-
112
-
113
-
114
-
115
-
116
-
117
-
118
-
 119
119 -
 120
120 -
 121
121 -
 122
122 -
 123
123 -
 124
124 -
 125
125 -
 126
126 -
 127
127 -
 128
128 -
 129
129 -
 130
130 -
 131
131 -
 132
132 -
 133
133 -
 134
134 -
 135
135 -
 136
136 -
 137
137 -
 138
138 -
 139
139 -
140
-
141
-
142
-
143
-
144
-
145
-
146
-
147
-
148
-
149
-
150
-
151
-
152
-
153
-
154
-
155
-
156
-
157
-
158
-
159
-
160
-
161
-
162
-
163
-
164
-
165
-
166
-
167
-
168
-
169
-
170
-
171
-
172
-
173
-
174
-
175
-
176
-
177
-
178
-
179
-
180
-
181
-
182
-
183
-
184
-
185
-
186
-
187
-
188
-
189
-
190
-
191
-
192
-
193
-
194
-
195
-
196
-
197
-
198
-
199
-
200
-
201
-
202
-
203
-
204
-
205
-
206
-
207
-
208
-
209
-
210
-
211
-
212
-
213
-
214
-
215
-
216
-
217
-
218
-
219
-
220
-
221
-
222
-
223
-
224
-
225
-
226
-
227
-
228
-
229
-
230
-
231
-
232
-
233
-
234
-
235
-
236
-
237
-
238
-
239
-
240
-
241
-
242
-
243
-
244
-
245
-
246
-
247
-
248
-
249
-
250
-
251
-
252
-
253
-
254
-
255
-
256
-
257
-
258
-
259
-
260
-
261
-
262
-
263
-
264
-
265
-
266
-
267
-
268
-
269
-
270
-
271
-
272
-
273
-
274
-
275
-
276
-
277
-
278
-
279
-
280
-
281
-
282
-
283
-
284
-
285
-
286
-
287
-
288
-
289
-
290
-
291
-
292
-
293
-
294
-
295
-
296
-
297
-
298
-
299
-
300
-
301
-
302
-
303
-
304
-
305
-
306
-
307
-
308
-
309
-
310
-
311
-
312
-
313
-
314
-
315
-
316
-
317
-
318
-
319
-
320
-
321
-
322
-
323
-
324
-
325
-
326
-
327
-
328
-
329
-
330
-
331
-
332
-
333
-
334
-
335
-
336
-
337
-
338
-
339
-
340
-
341
-
342
-
343
-
344
-
345
-
346
-
347
-
348
-
349
-
350
-
351
-
352
-
353
-
354
-
355
-
356
-
357
-
358
-
359
-
360
-
361
-
362
-
363
-
364
-
365
-
366
-
367
-
368
-
369
-
370
-
371
-
372
-
373
-
374
-
375
-
376
-
377
-
378
-
379
-
380
-
381
-
382
-
383
-
384
-
385
-
386
-
387
-
388
-
389
-
390
-
391
-
392
-
393
-
394
-
395
-
396
-
397
-
398
-
399
-
400
-
401
-
402
-
403
-
404
-
405
-
406
-
407
-
408
-
409
-
410
-
411
-
412
-
413
-
414
-
415
-
416
-
417
-
418
-
419
-
420
-
421
-
422
-
423
-
424
 |
 |

127
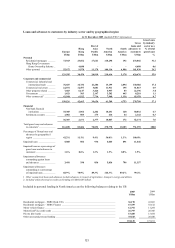
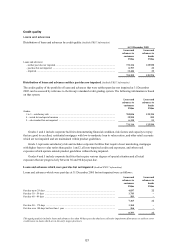
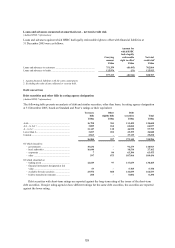
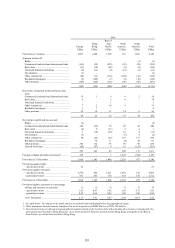
Credit quality
Loans and advances
Distribution of loans and advances by credit quality (Audited IFRS 7 information)
At 31 December 2005
Loans and
advances to
customers
Loans and
advances to
banks
US$m US$m
Loans and advances:
– neither past due nor impaired .................................................................................................. 731,116 125,930
– past due but not impaired ........................................................................................................ 8,797 22
– impaired .................................................................................................................................. 11,446 22
751,359 125,974
Distribution of loans and advances neither past due nor impaired (Audited IFRS 7 information)
The credit quality of the portfolio of loans and advances that were neither past due nor impaired at 31 December
2005 can be assessed by reference to the Group’s standard credit grading system. The following information is based
on that system:
Loans and
advances to
customers
Loans and
advances to
banks
US$m US$m
Grades:
1 to 3 – satisfactory risk ............................................................................................................. 705,036 125,324
4 – watch list and special mention .............................................................................................. 19,950 555
5 – sub-standard but not impaired ..............................................................................................6,130 51
731,116 125,930
Grades 1 and 2 include corporate facilities demonstrating financial condition, risk factors and capacity to repay
that are good to excellent, residential mortgages with low to moderate loan to values ratios, and other retail accounts
which are not impaired and are maintained within product guidelines.
Grade 3 represents satisfactory risk and includes corporate facilities that require closer monitoring, mortgages
with higher loan to value ratios than grades 1 and 2, all non-impaired credit card exposures, and other retail
exposures which operate outside product guidelines without being impaired.
Grades 4 and 5 include corporate facilities that require various degrees of special attention and all retail
exposures that are progressively between 30 and 90 days past due.
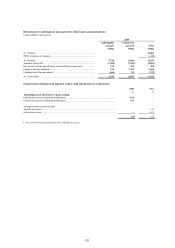
Loans and advances which were past due but not impaired (Audited IFRS 7 information)
Loans and advances which were past due at 31 December 2005 but not impaired were as follows:
Loans and
advances to
customers
Loans and
advances to
banks
US$m US$m
Past due up to 29 days .................................................................................................................... 4,837 22
Past due 30 – 59 days ..................................................................................................................... 1,743 –
Past due 60 – 89 days ..................................................................................................................... 583 –
7,163 22
Past due 90 – 179 days ................................................................................................................... 1,368 –
Past due over 180 days but less than 1 year ....................................................................................266 –
8,797 22
This ageing analysis includes loans and advances less than 90 days past due that have collective impairment allowances set aside to cover
credit losses on loans which are in the early stages of arrears.