HSBC 2005 Annual Report Download - page 33
Download and view the complete annual report
Please find page 33 of the 2005 HSBC annual report below. You can navigate through the pages in the report by either clicking on the pages listed below, or by using the keyword search tool below to find specific information within the annual report.-
 1
1 -
2
-
3
-
4
-
5
-
6
-
7
-
8
-
9
-
10
-
11
-
12
-
13
-
14
-
15
-
16
-
17
-
18
-
19
-
20
-
21
-
22
-
 23
23 -
 24
24 -
 25
25 -
 26
26 -
 27
27 -
 28
28 -
 29
29 -
 30
30 -
 31
31 -
 32
32 -
 33
33 -
 34
34 -
 35
35 -
 36
36 -
 37
37 -
 38
38 -
 39
39 -
 40
40 -
 41
41 -
 42
42 -
 43
43 -
44
-
45
-
46
-
47
-
48
-
49
-
50
-
51
-
52
-
53
-
54
-
55
-
56
-
57
-
58
-
59
-
60
-
61
-
62
-
63
-
64
-
65
-
66
-
67
-
68
-
69
-
70
-
71
-
72
-
73
-
74
-
75
-
76
-
77
-
78
-
79
-
80
-
81
-
82
-
83
-
84
-
85
-
86
-
87
-
88
-
89
-
90
-
91
-
92
-
93
-
94
-
95
-
96
-
97
-
98
-
99
-
100
-
101
-
102
-
103
-
104
-
105
-
106
-
107
-
108
-
109
-
110
-
111
-
112
-
113
-
114
-
115
-
116
-
117
-
118
-
119
-
120
-
121
-
122
-
123
-
124
-
125
-
126
-
127
-
128
-
129
-
130
-
131
-
132
-
133
-
134
-
135
-
136
-
137
-
138
-
139
-
140
-
141
-
142
-
143
-
144
-
145
-
146
-
147
-
148
-
149
-
150
-
151
-
152
-
153
-
154
-
155
-
156
-
157
-
158
-
159
-
160
-
161
-
162
-
163
-
164
-
165
-
166
-
167
-
168
-
169
-
170
-
171
-
172
-
173
-
174
-
175
-
176
-
177
-
178
-
179
-
180
-
181
-
182
-
183
-
184
-
185
-
186
-
187
-
188
-
189
-
190
-
191
-
192
-
193
-
194
-
195
-
196
-
197
-
198
-
199
-
200
-
201
-
202
-
203
-
204
-
205
-
206
-
207
-
208
-
209
-
210
-
211
-
212
-
213
-
214
-
215
-
216
-
217
-
218
-
219
-
220
-
221
-
222
-
223
-
224
-
225
-
226
-
227
-
228
-
229
-
230
-
231
-
232
-
233
-
234
-
235
-
236
-
237
-
238
-
239
-
240
-
241
-
242
-
243
-
244
-
245
-
246
-
247
-
248
-
249
-
250
-
251
-
252
-
253
-
254
-
255
-
256
-
257
-
258
-
259
-
260
-
261
-
262
-
263
-
264
-
265
-
266
-
267
-
268
-
269
-
270
-
271
-
272
-
273
-
274
-
275
-
276
-
277
-
278
-
279
-
280
-
281
-
282
-
283
-
284
-
285
-
286
-
287
-
288
-
289
-
290
-
291
-
292
-
293
-
294
-
295
-
296
-
297
-
298
-
299
-
300
-
301
-
302
-
303
-
304
-
305
-
306
-
307
-
308
-
309
-
310
-
311
-
312
-
313
-
314
-
315
-
316
-
317
-
318
-
319
-
320
-
321
-
322
-
323
-
324
-
325
-
326
-
327
-
328
-
329
-
330
-
331
-
332
-
333
-
334
-
335
-
336
-
337
-
338
-
339
-
340
-
341
-
342
-
343
-
344
-
345
-
346
-
347
-
348
-
349
-
350
-
351
-
352
-
353
-
354
-
355
-
356
-
357
-
358
-
359
-
360
-
361
-
362
-
363
-
364
-
365
-
366
-
367
-
368
-
369
-
370
-
371
-
372
-
373
-
374
-
375
-
376
-
377
-
378
-
379
-
380
-
381
-
382
-
383
-
384
-
385
-
386
-
387
-
388
-
389
-
390
-
391
-
392
-
393
-
394
-
395
-
396
-
397
-
398
-
399
-
400
-
401
-
402
-
403
-
404
-
405
-
406
-
407
-
408
-
409
-
410
-
411
-
412
-
413
-
414
-
415
-
416
-
417
-
418
-
419
-
420
-
421
-
422
-
423
-
424
 |
 |
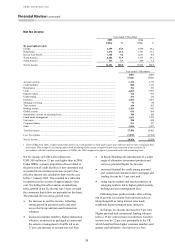
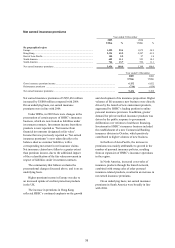
31
increased by 9 per cent, reflecting increased
customer numbers, the launch of a new packaged
product in the UK and the introduction of a Small
Business Tariff in Commercial Banking. Buoyant
equity markets benefited custody fees, which grew
as a result of both increased asset values and strong
new business volumes. Private Banking fee income
was 12 per cent higher than in 2004 following
increases in client assets under management and
transaction volumes.
In Hong Kong, net fee income was in line with
2004. Unit trust fees decreased by 42 per cent as
Personal Financial Services customers switched to
traditional deposit savings and shorter-term
investment products. The launch of 173 new open-
ended funds established HSBC as the leading
investment service provider in Hong Kong. This,
together with the successful attraction of client assets
in Private Banking, contributed to a rise in income
from funds under management. Credit card fee
income increased by 18 per cent, reflecting growth
in cardholder spending as HSBC strengthened its
position as the largest credit card issuer in Hong
Kong. In Commercial Banking, net fees increased as
trade services, insurance and lending income rose.
However, lower Structured Finance revenues led to
reduced Corporate, Investment Banking and Markets
fees.
Net fee income in the Rest of Asia-Pacific rose
by 28 per cent from higher card transaction volumes
and increased account service fees in response to the
expansion of the Personal Financial Services
business in the region. Rising equity markets,
buoyant regional economies and an increase in
personal wealth combined with the launch of new
products to increase sales of investment products to
personal customers. Client assets in Private Banking
also grew. Global Transaction Banking revenues
increased in line with transaction volumes following
investment in 2004 to expand capabilities. Custody
fees grew by 29 per cent as a result of improved
investor sentiment and rising local equity markets.
Trade services income rose by 13 per cent, reflecting
strong trade flows.
In North America, net fee income grew by
21 per cent. Card fee income grew as a result of
higher transactions, increased receivables and
improvements in the interchange rate, while US
mortgage lending fees benefited from lower
refinancing prepayments and the consequent release
of impairment provisions on mortgage servicing
rights. In Mexico, strong growth in the cards base
drove higher net fee income and increased
transaction volumes delivered higher ATM fees and
increased remittance income. Investment banking
fees increased in response to HSBC’s success in
attracting customers with an expanded range of
products.
Net fee income in South America increased by
23 per cent, principally due to higher card, lending
and current account servicing fees. Current account
fees benefited from increased customer numbers and
tariff increases, while lending fee growth was
principally related to higher lending volumes. Card
fees increased as a result of higher spending in both
Brazil and Argentina.