HSBC 2005 Annual Report Download - page 311
Download and view the complete annual report
Please find page 311 of the 2005 HSBC annual report below. You can navigate through the pages in the report by either clicking on the pages listed below, or by using the keyword search tool below to find specific information within the annual report.-
 1
1 -
2
-
3
-
4
-
5
-
6
-
7
-
8
-
9
-
10
-
11
-
12
-
13
-
14
-
15
-
16
-
17
-
18
-
19
-
20
-
21
-
22
-
23
-
24
-
25
-
26
-
27
-
28
-
29
-
30
-
31
-
32
-
33
-
34
-
35
-
36
-
37
-
38
-
39
-
40
-
41
-
42
-
43
-
44
-
45
-
46
-
47
-
48
-
49
-
50
-
51
-
52
-
53
-
54
-
55
-
56
-
57
-
58
-
59
-
60
-
61
-
62
-
63
-
64
-
65
-
66
-
67
-
68
-
69
-
70
-
71
-
72
-
73
-
74
-
75
-
76
-
77
-
78
-
79
-
80
-
81
-
82
-
83
-
84
-
85
-
86
-
87
-
88
-
89
-
90
-
91
-
92
-
93
-
94
-
95
-
96
-
97
-
98
-
99
-
100
-
101
-
102
-
103
-
104
-
105
-
106
-
107
-
108
-
109
-
110
-
111
-
112
-
113
-
114
-
115
-
116
-
117
-
118
-
119
-
120
-
121
-
122
-
123
-
124
-
125
-
126
-
127
-
128
-
129
-
130
-
131
-
132
-
133
-
134
-
135
-
136
-
137
-
138
-
139
-
140
-
141
-
142
-
143
-
144
-
145
-
146
-
147
-
148
-
149
-
150
-
151
-
152
-
153
-
154
-
155
-
156
-
157
-
158
-
159
-
160
-
161
-
162
-
163
-
164
-
165
-
166
-
167
-
168
-
169
-
170
-
171
-
172
-
173
-
174
-
175
-
176
-
177
-
178
-
179
-
180
-
181
-
182
-
183
-
184
-
185
-
186
-
187
-
188
-
189
-
190
-
191
-
192
-
193
-
194
-
195
-
196
-
197
-
198
-
199
-
200
-
201
-
202
-
203
-
204
-
205
-
206
-
207
-
208
-
209
-
210
-
211
-
212
-
213
-
214
-
215
-
216
-
217
-
218
-
219
-
220
-
221
-
222
-
223
-
224
-
225
-
226
-
227
-
228
-
229
-
230
-
231
-
232
-
233
-
234
-
235
-
236
-
237
-
238
-
239
-
240
-
241
-
242
-
243
-
244
-
245
-
246
-
247
-
248
-
249
-
250
-
251
-
252
-
253
-
254
-
255
-
256
-
257
-
258
-
259
-
260
-
261
-
262
-
263
-
264
-
265
-
266
-
267
-
268
-
269
-
270
-
271
-
272
-
273
-
274
-
275
-
276
-
277
-
278
-
279
-
280
-
281
-
282
-
283
-
284
-
285
-
286
-
287
-
288
-
289
-
290
-
291
-
292
-
293
-
294
-
295
-
296
-
297
-
298
-
299
-
300
-
 301
301 -
 302
302 -
 303
303 -
 304
304 -
 305
305 -
 306
306 -
 307
307 -
 308
308 -
 309
309 -
 310
310 -
 311
311 -
 312
312 -
 313
313 -
 314
314 -
 315
315 -
 316
316 -
 317
317 -
 318
318 -
 319
319 -
 320
320 -
 321
321 -
322
-
323
-
324
-
325
-
326
-
327
-
328
-
329
-
330
-
331
-
332
-
333
-
334
-
335
-
336
-
337
-
338
-
339
-
340
-
341
-
342
-
343
-
344
-
345
-
346
-
347
-
348
-
349
-
350
-
351
-
352
-
353
-
354
-
355
-
356
-
357
-
358
-
359
-
360
-
361
-
362
-
363
-
364
-
365
-
366
-
367
-
368
-
369
-
370
-
371
-
372
-
373
-
374
-
375
-
376
-
377
-
378
-
379
-
380
-
381
-
382
-
383
-
384
-
385
-
386
-
387
-
388
-
389
-
390
-
391
-
392
-
393
-
394
-
395
-
396
-
397
-
398
-
399
-
400
-
401
-
402
-
403
-
404
-
405
-
406
-
407
-
408
-
409
-
410
-
411
-
412
-
413
-
414
-
415
-
416
-
417
-
418
-
419
-
420
-
421
-
422
-
423
-
424
 |
 |

309
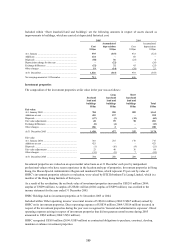
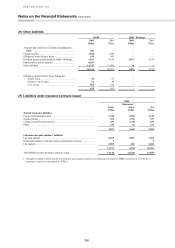
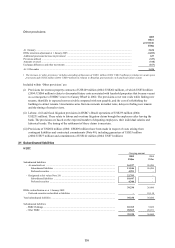
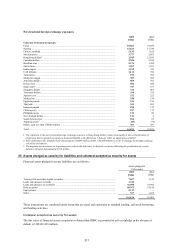
Other provisions
2005
Other
provisions
US$m
At 1 January .............................................................................................................................................................. 2,636
IFRSs transition adjustment at 1 January 2005 ......................................................................................................... (1,033)
Additional provisions/increase in provisions1 ........................................................................................................... 637
Provisions utilised ..................................................................................................................................................... (327)
Amounts reversed ...................................................................................................................................................... (310)
Exchange differences and other movements .............................................................................................................. (167)
At 31 December ........................................................................................................................................................ 1,436
1The increase in ‘other provisions’ includes unwinding of discounts of US$11 million (2004: US$12 million) in relation to vacant space
provisions and US$23 million (2004: US$19 million) in relation to Brazilian provisions for civil and fiscal labour claims.
Included within ‘Other provisions’ are:
(i) Provisions for onerous property contracts of US$149 million (2004: US$202 million), of which US$74 million
(2004: US$66 million) relates to discounted future costs associated with leasehold properties that became vacant
as a consequence of HSBC’s move to Canary Wharf in 2002. The provisions cover rent voids while finding new
tenants, shortfalls in expected rent receivable compared with rent payable, and the cost of refurbishing the
buildings to attract tenants. Uncertainties arise from movements in market rents, delays in finding new tenants
and the timing of rental reviews.
(ii) Labour, civil and fiscal litigation provisions in HSBC’s Brazil operations of US$235 million (2004:
US$231 million). These relate to labour and overtime litigation claims brought by employees after leaving the
bank. The provisions are based on the expected number of departing employees, their individual salaries and
historical trends. The timing of the settlement of these claims is uncertain.
(iii) Provisions of US$652 million (2004: US$809 million) have been made in respect of costs arising from
contingent liabilities and contractual commitments (Note 40), including guarantees of US$55 million
(2004: US$77 million) and commitments of US$122 million (2004: US$71 million).
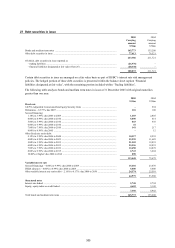
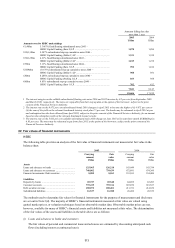
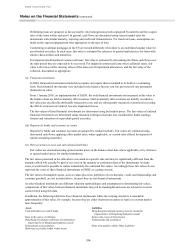
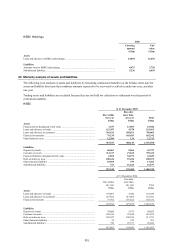
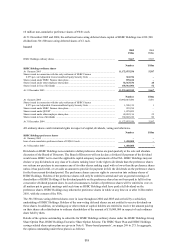
31 Subordinated liabilities
HSBC
Carrying amount
2005 2004
US$m US$m
Subordinated liabilities:
– At amortised cost ................................................................................................................... 16,537 26,486
Subordinated liabilities ...................................................................................................... 11,546 26,486
Preferred securities ............................................................................................................. 4,991 –
– Designated at fair value (Note 26) ......................................................................................... 22,793 –
Subordinated liabilities ...................................................................................................... 18,447 –
Preferred securities ............................................................................................................. 4,346 –
39,330 26,486
IFRSs reclassification as at 1 January 2005:
– Preferred securities reclassified as liabilities .......................................................................... –10,114
Total subordinated liabilities .......................................................................................................... 39,330 36,600
Subordinated liabilities:
– HSBC Holdings ....................................................................................................................... 10,765 9,669
– Other HSBC ............................................................................................................................ 28,565 26,931
39,330 36,600