HSBC 2005 Annual Report Download - page 34
Download and view the complete annual report
Please find page 34 of the 2005 HSBC annual report below. You can navigate through the pages in the report by either clicking on the pages listed below, or by using the keyword search tool below to find specific information within the annual report.-
 1
1 -
2
-
3
-
4
-
5
-
6
-
7
-
8
-
9
-
10
-
11
-
12
-
13
-
14
-
15
-
16
-
17
-
18
-
19
-
20
-
21
-
22
-
23
-
 24
24 -
 25
25 -
 26
26 -
 27
27 -
 28
28 -
 29
29 -
 30
30 -
 31
31 -
 32
32 -
 33
33 -
 34
34 -
 35
35 -
 36
36 -
 37
37 -
 38
38 -
 39
39 -
 40
40 -
 41
41 -
 42
42 -
 43
43 -
 44
44 -
45
-
46
-
47
-
48
-
49
-
50
-
51
-
52
-
53
-
54
-
55
-
56
-
57
-
58
-
59
-
60
-
61
-
62
-
63
-
64
-
65
-
66
-
67
-
68
-
69
-
70
-
71
-
72
-
73
-
74
-
75
-
76
-
77
-
78
-
79
-
80
-
81
-
82
-
83
-
84
-
85
-
86
-
87
-
88
-
89
-
90
-
91
-
92
-
93
-
94
-
95
-
96
-
97
-
98
-
99
-
100
-
101
-
102
-
103
-
104
-
105
-
106
-
107
-
108
-
109
-
110
-
111
-
112
-
113
-
114
-
115
-
116
-
117
-
118
-
119
-
120
-
121
-
122
-
123
-
124
-
125
-
126
-
127
-
128
-
129
-
130
-
131
-
132
-
133
-
134
-
135
-
136
-
137
-
138
-
139
-
140
-
141
-
142
-
143
-
144
-
145
-
146
-
147
-
148
-
149
-
150
-
151
-
152
-
153
-
154
-
155
-
156
-
157
-
158
-
159
-
160
-
161
-
162
-
163
-
164
-
165
-
166
-
167
-
168
-
169
-
170
-
171
-
172
-
173
-
174
-
175
-
176
-
177
-
178
-
179
-
180
-
181
-
182
-
183
-
184
-
185
-
186
-
187
-
188
-
189
-
190
-
191
-
192
-
193
-
194
-
195
-
196
-
197
-
198
-
199
-
200
-
201
-
202
-
203
-
204
-
205
-
206
-
207
-
208
-
209
-
210
-
211
-
212
-
213
-
214
-
215
-
216
-
217
-
218
-
219
-
220
-
221
-
222
-
223
-
224
-
225
-
226
-
227
-
228
-
229
-
230
-
231
-
232
-
233
-
234
-
235
-
236
-
237
-
238
-
239
-
240
-
241
-
242
-
243
-
244
-
245
-
246
-
247
-
248
-
249
-
250
-
251
-
252
-
253
-
254
-
255
-
256
-
257
-
258
-
259
-
260
-
261
-
262
-
263
-
264
-
265
-
266
-
267
-
268
-
269
-
270
-
271
-
272
-
273
-
274
-
275
-
276
-
277
-
278
-
279
-
280
-
281
-
282
-
283
-
284
-
285
-
286
-
287
-
288
-
289
-
290
-
291
-
292
-
293
-
294
-
295
-
296
-
297
-
298
-
299
-
300
-
301
-
302
-
303
-
304
-
305
-
306
-
307
-
308
-
309
-
310
-
311
-
312
-
313
-
314
-
315
-
316
-
317
-
318
-
319
-
320
-
321
-
322
-
323
-
324
-
325
-
326
-
327
-
328
-
329
-
330
-
331
-
332
-
333
-
334
-
335
-
336
-
337
-
338
-
339
-
340
-
341
-
342
-
343
-
344
-
345
-
346
-
347
-
348
-
349
-
350
-
351
-
352
-
353
-
354
-
355
-
356
-
357
-
358
-
359
-
360
-
361
-
362
-
363
-
364
-
365
-
366
-
367
-
368
-
369
-
370
-
371
-
372
-
373
-
374
-
375
-
376
-
377
-
378
-
379
-
380
-
381
-
382
-
383
-
384
-
385
-
386
-
387
-
388
-
389
-
390
-
391
-
392
-
393
-
394
-
395
-
396
-
397
-
398
-
399
-
400
-
401
-
402
-
403
-
404
-
405
-
406
-
407
-
408
-
409
-
410
-
411
-
412
-
413
-
414
-
415
-
416
-
417
-
418
-
419
-
420
-
421
-
422
-
423
-
424
 |
 |

HSBC HOLDINGS PLC
Financial Review (continued)
32
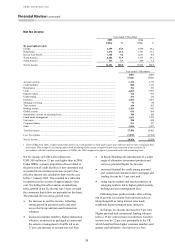
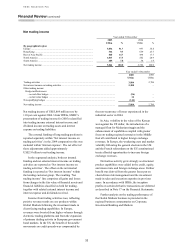
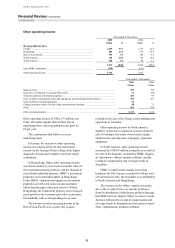
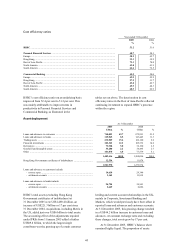
Net trading income
Year ended 31 December
2005 2004
US$m % US$m %
By geographical region
Europe ....................................................................................................... 3,036 51.7 997 35.8
Hong Kong ................................................................................................ 546 9.3 659 23.7
Rest of Asia-Pacific ................................................................................... 860 14.7 494 17.7
North America ........................................................................................... 1,013 17.3 582 20.9
South America ........................................................................................... 409 7.0 54 1.9
Net trading income .................................................................................... 5,864 100.0 2,786 100.0
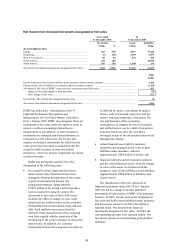
Year ended 31 December
2005
US$m
2004
US$m
Trading activities ............................................................................................................................ 3,884 2,786
Net interest income on trading activities ......................................................................................... 2,208 –
Other trading income
Hedge ineffectiveness:
– on cash flow hedges .............................................................................................................. (96) –
– on fair value hedges .............................................................................................................. 14 –
Non-qualifying hedges ................................................................................................................... (146) –
Net trading income ......................................................................................................................... 5,864 2,786
Net trading income of US$5,864 million rose by
110 per cent against 2004. Under IFRSs, HSBC’s
presentation of trading income for 2005 reclassified
into trading income external interest income and
dividend income on trading assets and interest
expense on trading liabilities.
The external funding of long trading positions is
reported separately within ‘Net interest income on
trading activities’; in the 2004 comparatives this was
included within ‘Interest expense’. The net effect of
these adjustments added approximately
US$2.9 billion to net trading income.
In the segmental analysis, both net internal
funding and net external interest income on trading
activities are reported as ‘Net interest income on
trading activities’. The offset on the net internal
funding is reported as ‘Net interest income’ within
the lending customer group. The resulting ‘Net
trading income’ line comprises all gains and losses
from changes in the fair value of financial assets and
financial liabilities classified as held for trading,
together with related external interest income and
interest expense and dividends received.
Income from trading activities rose, reflecting
positive revenue trends on core products within
Global Markets following the investment made in
client-facing trading capabilities. In Europe,
revenues were boosted from higher volumes through
electronic trading platforms and from the expansion
of primary dealing activity in European government
bond markets. In the US, the benefit of favourable
movements on credit spreads was compounded by
the non-recurrence of losses experienced in the
industrial sector in 2004.
In Asia, volatility in the value of the Korean
won against the US dollar, the introduction of a
managed float for Malaysian ringgit and the
enhancement of capabilities coupled with greater
focus on trading regional currencies in the Middle
East all contributed to higher foreign exchange
revenues. In Europe, the weakening euro and market
volatility following the general election in the UK
and the French referendum on the EU constitutional
treaty afforded opportunities to increase foreign
exchange revenues.
Derivatives activity grew strongly as structured
product capabilities were added in the credit, equity,
and interest rate and foreign exchange areas. Further
benefit was derived from the greater focus put on
client-driven risk management and the investment
made in sales and execution expertise in previous
years. In accordance with IFRSs, the inception
profits on certain derivative transactions are deferred
as described in Note 17 on the Financial Statements.
Further analysis on the trading performance of
the Global Markets business is provided in the
regional business commentaries on Corporate,
Investment Banking and Markets.