HSBC 2005 Annual Report Download - page 155
Download and view the complete annual report
Please find page 155 of the 2005 HSBC annual report below. You can navigate through the pages in the report by either clicking on the pages listed below, or by using the keyword search tool below to find specific information within the annual report.-
 1
1 -
2
-
3
-
4
-
5
-
6
-
7
-
8
-
9
-
10
-
11
-
12
-
13
-
14
-
15
-
16
-
17
-
18
-
19
-
20
-
21
-
22
-
23
-
24
-
25
-
26
-
27
-
28
-
29
-
30
-
31
-
32
-
33
-
34
-
35
-
36
-
37
-
38
-
39
-
40
-
41
-
42
-
43
-
44
-
45
-
46
-
47
-
48
-
49
-
50
-
51
-
52
-
53
-
54
-
55
-
56
-
57
-
58
-
59
-
60
-
61
-
62
-
63
-
64
-
65
-
66
-
67
-
68
-
69
-
70
-
71
-
72
-
73
-
74
-
75
-
76
-
77
-
78
-
79
-
80
-
81
-
82
-
83
-
84
-
85
-
86
-
87
-
88
-
89
-
90
-
91
-
92
-
93
-
94
-
95
-
96
-
97
-
98
-
99
-
100
-
101
-
102
-
103
-
104
-
105
-
106
-
107
-
108
-
109
-
110
-
111
-
112
-
113
-
114
-
115
-
116
-
117
-
118
-
119
-
120
-
121
-
122
-
123
-
124
-
125
-
126
-
127
-
128
-
129
-
130
-
131
-
132
-
133
-
134
-
135
-
136
-
137
-
138
-
139
-
140
-
141
-
142
-
143
-
144
-
 145
145 -
 146
146 -
 147
147 -
 148
148 -
 149
149 -
 150
150 -
 151
151 -
 152
152 -
 153
153 -
 154
154 -
 155
155 -
 156
156 -
 157
157 -
 158
158 -
 159
159 -
 160
160 -
 161
161 -
 162
162 -
 163
163 -
 164
164 -
 165
165 -
166
-
167
-
168
-
169
-
170
-
171
-
172
-
173
-
174
-
175
-
176
-
177
-
178
-
179
-
180
-
181
-
182
-
183
-
184
-
185
-
186
-
187
-
188
-
189
-
190
-
191
-
192
-
193
-
194
-
195
-
196
-
197
-
198
-
199
-
200
-
201
-
202
-
203
-
204
-
205
-
206
-
207
-
208
-
209
-
210
-
211
-
212
-
213
-
214
-
215
-
216
-
217
-
218
-
219
-
220
-
221
-
222
-
223
-
224
-
225
-
226
-
227
-
228
-
229
-
230
-
231
-
232
-
233
-
234
-
235
-
236
-
237
-
238
-
239
-
240
-
241
-
242
-
243
-
244
-
245
-
246
-
247
-
248
-
249
-
250
-
251
-
252
-
253
-
254
-
255
-
256
-
257
-
258
-
259
-
260
-
261
-
262
-
263
-
264
-
265
-
266
-
267
-
268
-
269
-
270
-
271
-
272
-
273
-
274
-
275
-
276
-
277
-
278
-
279
-
280
-
281
-
282
-
283
-
284
-
285
-
286
-
287
-
288
-
289
-
290
-
291
-
292
-
293
-
294
-
295
-
296
-
297
-
298
-
299
-
300
-
301
-
302
-
303
-
304
-
305
-
306
-
307
-
308
-
309
-
310
-
311
-
312
-
313
-
314
-
315
-
316
-
317
-
318
-
319
-
320
-
321
-
322
-
323
-
324
-
325
-
326
-
327
-
328
-
329
-
330
-
331
-
332
-
333
-
334
-
335
-
336
-
337
-
338
-
339
-
340
-
341
-
342
-
343
-
344
-
345
-
346
-
347
-
348
-
349
-
350
-
351
-
352
-
353
-
354
-
355
-
356
-
357
-
358
-
359
-
360
-
361
-
362
-
363
-
364
-
365
-
366
-
367
-
368
-
369
-
370
-
371
-
372
-
373
-
374
-
375
-
376
-
377
-
378
-
379
-
380
-
381
-
382
-
383
-
384
-
385
-
386
-
387
-
388
-
389
-
390
-
391
-
392
-
393
-
394
-
395
-
396
-
397
-
398
-
399
-
400
-
401
-
402
-
403
-
404
-
405
-
406
-
407
-
408
-
409
-
410
-
411
-
412
-
413
-
414
-
415
-
416
-
417
-
418
-
419
-
420
-
421
-
422
-
423
-
424
 |
 |
153
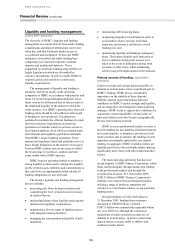
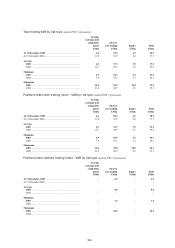
technique that estimates the potential losses that
could occur on risk positions as a result of
movements in market rates and prices over a
specified time horizon and to a given level of
confidence (for HSBC, 99 per cent). HSBC
calculates VAR daily. The VAR model used by
HSBC is predominantly based on historical
simulation. The historical simulation model derives
plausible future scenarios from historical market rate
time series, taking account of inter-relationships
between different markets and rates, for example,
between interest rates and foreign exchange rates.
Potential movements in market prices are calculated
with reference to market data from the last two
years. The model incorporates the impact of option
features in the underlying exposures. HSBC has
changed the assumed holding period from a 10-day
period to a 1-day period as this reflects the way the
risk positions are managed. Comparative VAR
numbers have been restated to reflect this change.
Although a valuable guide to risk, VAR should
always be viewed in the context of its limitations.
For example:
• the use of historical data as a proxy for
estimating future events may not encompass all
potential events, particularly those which are
extreme in nature;
• the use of a 1-day holding period assumes that
all positions can be liquidated or hedged in one
day. This may not fully reflect the market risk
arising at times of severe illiquidity, when a
1-day holding period may be insufficient to
liquidate or hedge all positions fully;
• the use of a 99 per cent confidence level, by
definition, does not take into account losses that
might occur beyond this level of confidence;
and
• VAR is calculated on the basis of exposures
outstanding at the close of business and
therefore does not necessarily reflect intra-day
exposures.
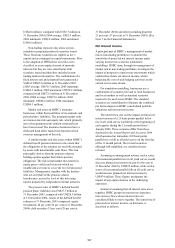
HSBC recognises these limitations by
augmenting its VAR limits with other position and
sensitivity limit structures. Additionally, HSBC
applies a wide range of stress testing, both on
individual portfolios and on the Group’s
consolidated positions. HSBC’s stress-testing regime
provides senior management with an assessment of
the financial impact of identified extreme events on
the market risk exposures of HSBC.
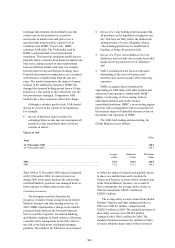
The VAR, both trading and non-trading, for
Global Markets was as follows:
Value at risk
US$m
Total
At 31 December 2005 ..................................................................................................................................................... 128.5
At 31 December 2004 ...................................................................................................................................................... 254.7
Average Minimum Maximum
US$m US$m US$m
2005 .................................................................................................................... 174.1 108.2 248.8
2004 .................................................................................................................... 172.5 101.2 304.2
Total VAR at 31 December 2005 reduced compared
with 31 December 2004. As interest rates rose
during 2005 in the major markets, the risk arising
in Global Markets’ positions was managed down to
limit exposure to further interest rate rises.
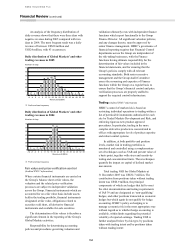
(Unaudited information)
The histogram overleaf illustrates the
frequency of daily revenue arising from all Global
Markets’ business and other trading activities. In
2005, HSBC implemented a change in the transfer
pricing of funds between the Personal Financial
Services and the Corporate, Investment Banking
and Markets segments in North America, following
a transfer of the management of all of the interest
rate risk of the held prime residential mortgage
portfolio. The numbers for 2004 have been restated
to reflect the impact of transfer pricing had it been
in place on a similar basis and to include the
Futures and Equities revenues which comprise part
of the Global Markets’ business. As a result of
these restatements, the average daily revenue in
2004 increased from US$18.3 million to
US$20.5 million.
The average daily revenue earned from Global
Markets’ business and other trading activities in
2005 was US$18.7 million, compared with
US$20.5 million in 2004. The standard deviation of
these daily revenues was US$10.4 million
compared with US$8.1 million for 2004. The
standard deviation measures the variation of daily
revenues about the mean value of those revenues.