HSBC 2005 Annual Report Download - page 265
Download and view the complete annual report
Please find page 265 of the 2005 HSBC annual report below. You can navigate through the pages in the report by either clicking on the pages listed below, or by using the keyword search tool below to find specific information within the annual report.-
 1
1 -
2
-
3
-
4
-
5
-
6
-
7
-
8
-
9
-
10
-
11
-
12
-
13
-
14
-
15
-
16
-
17
-
18
-
19
-
20
-
21
-
22
-
23
-
24
-
25
-
26
-
27
-
28
-
29
-
30
-
31
-
32
-
33
-
34
-
35
-
36
-
37
-
38
-
39
-
40
-
41
-
42
-
43
-
44
-
45
-
46
-
47
-
48
-
49
-
50
-
51
-
52
-
53
-
54
-
55
-
56
-
57
-
58
-
59
-
60
-
61
-
62
-
63
-
64
-
65
-
66
-
67
-
68
-
69
-
70
-
71
-
72
-
73
-
74
-
75
-
76
-
77
-
78
-
79
-
80
-
81
-
82
-
83
-
84
-
85
-
86
-
87
-
88
-
89
-
90
-
91
-
92
-
93
-
94
-
95
-
96
-
97
-
98
-
99
-
100
-
101
-
102
-
103
-
104
-
105
-
106
-
107
-
108
-
109
-
110
-
111
-
112
-
113
-
114
-
115
-
116
-
117
-
118
-
119
-
120
-
121
-
122
-
123
-
124
-
125
-
126
-
127
-
128
-
129
-
130
-
131
-
132
-
133
-
134
-
135
-
136
-
137
-
138
-
139
-
140
-
141
-
142
-
143
-
144
-
145
-
146
-
147
-
148
-
149
-
150
-
151
-
152
-
153
-
154
-
155
-
156
-
157
-
158
-
159
-
160
-
161
-
162
-
163
-
164
-
165
-
166
-
167
-
168
-
169
-
170
-
171
-
172
-
173
-
174
-
175
-
176
-
177
-
178
-
179
-
180
-
181
-
182
-
183
-
184
-
185
-
186
-
187
-
188
-
189
-
190
-
191
-
192
-
193
-
194
-
195
-
196
-
197
-
198
-
199
-
200
-
201
-
202
-
203
-
204
-
205
-
206
-
207
-
208
-
209
-
210
-
211
-
212
-
213
-
214
-
215
-
216
-
217
-
218
-
219
-
220
-
221
-
222
-
223
-
224
-
225
-
226
-
227
-
228
-
229
-
230
-
231
-
232
-
233
-
234
-
235
-
236
-
237
-
238
-
239
-
240
-
241
-
242
-
243
-
244
-
245
-
246
-
247
-
248
-
249
-
250
-
251
-
252
-
253
-
254
-
 255
255 -
 256
256 -
 257
257 -
 258
258 -
 259
259 -
 260
260 -
 261
261 -
 262
262 -
 263
263 -
 264
264 -
 265
265 -
 266
266 -
 267
267 -
 268
268 -
 269
269 -
 270
270 -
 271
271 -
 272
272 -
 273
273 -
 274
274 -
 275
275 -
276
-
277
-
278
-
279
-
280
-
281
-
282
-
283
-
284
-
285
-
286
-
287
-
288
-
289
-
290
-
291
-
292
-
293
-
294
-
295
-
296
-
297
-
298
-
299
-
300
-
301
-
302
-
303
-
304
-
305
-
306
-
307
-
308
-
309
-
310
-
311
-
312
-
313
-
314
-
315
-
316
-
317
-
318
-
319
-
320
-
321
-
322
-
323
-
324
-
325
-
326
-
327
-
328
-
329
-
330
-
331
-
332
-
333
-
334
-
335
-
336
-
337
-
338
-
339
-
340
-
341
-
342
-
343
-
344
-
345
-
346
-
347
-
348
-
349
-
350
-
351
-
352
-
353
-
354
-
355
-
356
-
357
-
358
-
359
-
360
-
361
-
362
-
363
-
364
-
365
-
366
-
367
-
368
-
369
-
370
-
371
-
372
-
373
-
374
-
375
-
376
-
377
-
378
-
379
-
380
-
381
-
382
-
383
-
384
-
385
-
386
-
387
-
388
-
389
-
390
-
391
-
392
-
393
-
394
-
395
-
396
-
397
-
398
-
399
-
400
-
401
-
402
-
403
-
404
-
405
-
406
-
407
-
408
-
409
-
410
-
411
-
412
-
413
-
414
-
415
-
416
-
417
-
418
-
419
-
420
-
421
-
422
-
423
-
424
 |
 |

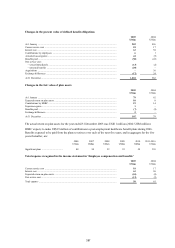
263
Discount
rate
Inflation
rate
Rate of
increase for
pensions in
payment
and deferred
pension
Rate
of pay
increase
Healthcare
cost trend
rates
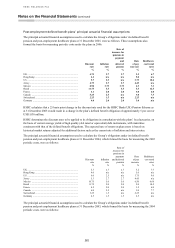
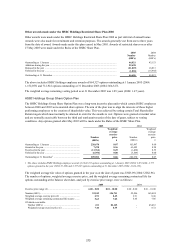
%%%%%
UK .................................................................................... 5.5 2.5 2.5 3.0 7.5
Hong Kong ....................................................................... 5.5 n/a n/a 4.5 n/a
US ..................................................................................... 6.25 2.5 n/a 3.75 12.9
Jersey ................................................................................ 5.5 2.5 2.5 4.25 n/a
Mexico .............................................................................. 10.75 5.0 5.0 7.5 8.68
Brazil ................................................................................ 11.3 5.0 5.0 5.11 8.15
France ............................................................................... 5.25 2.0 2.0 3.5 6.0
Canada .............................................................................. 6.25 2.0 n/a 3.0 8.2
Switzerland ....................................................................... 3.5 1.5 n/a 2.5 n/a
Germany ........................................................................... 5.25 1.5 1.5 2.5 n/a
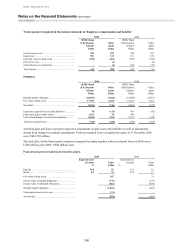
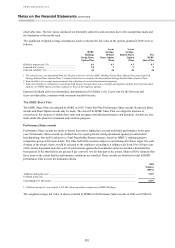
Mortality assumptions are increasingly significant in measuring the Group’s obligations under its defined benefit
pension and post-employment healthcare plans, particularly given the maturity of the plans. HSBC calculates that
each additional year of longevity assumed in calculating its defined benefit obligation for the HSBC Bank (UK)
Pension Scheme increases its obligation by approximately US$600 million. The mortality tables and average life
expectancy at 65 used at 31 December 2005 were as follows:
Mortality table
Life expectancy at
age 65 for a male
member currently:
Life expectancy at
age 65 for a female
member currently:
Aged 65 Aged 45 Aged 65 Aged 45
UK ........................................................................ PA92U2005 19.53 20.89 22.57 23.86
Hong Kong ........................................................... n/a n/a n/a n/a n/a
US ......................................................................... RP 2000 imp 2005 17.90 17.90 20.25 20.25
Jersey .................................................................... PA92C2036 20.83 20.83 23.75 23.75
Mexico .................................................................. GAM83M 16.56 16.56 16.56 16.56
Brazil .................................................................... AT83 18.51 18.51 21.89 21.89
France ................................................................... TPG93 23.02 25.32 23.02 25.32
Canada pension plans ........................................... UP94 C2012 and
UP94 C2027
18.65
and 19.84
18.65
and 19.84
21.37
and 22.00
21.37
and 22.00
Canada healthcare plan ......................................... GAM94M/F 17.88 17.88 21.32 21.32
Switzerland ........................................................... EVK2000 (3% loading) 18.30 18.30 21.21 21.21
Germany ............................................................... Heubeck 2005 G 18.06 20.84 22.20 24.85
The mortality tables and average life expectancy at 65 used at 31 December 2004 were as follows:
Mortality table
Life expectancy at
age 65 for a male
member currently:
Life expectancy at
age 65 for a female
member currently:
Aged 65 Aged 45 Aged 65 Aged 45
UK ........................................................................ PA92U2002 19.26 20.72 22.31 23.71
Hong Kong ........................................................... n/a n/a n/a n/a n/a
US ......................................................................... GAM83M/F 16.56 16.56 21.21 21.21
Jersey .................................................................... PA92C2036 20.83 20.83 23.75 23.75
Mexico .................................................................. UP84 15.17 15.17 15.17 15.17
Brazil .................................................................... AT83 18.51 18.51 21.89 21.89
France ................................................................... TPG93 23.02 25.32 23.02 25.32
Canada pension plans ........................................... UP94 C2012 and
UP94 C2027
18.65
and 19.84
18.65
and 19.84
21.37
and 22.00
21.37
and 22.00
Canada healthcare plan ......................................... GAM94M/F 17.88 17.88 21.32 21.32
Switzerland ........................................................... EVK2000 (3% loading) 18.30 18.30 21.21 21.21
Germany ............................................................... Heubeck Richttafeln 17.67 17.67 21.19 21.19