HSBC 2005 Annual Report Download - page 299
Download and view the complete annual report
Please find page 299 of the 2005 HSBC annual report below. You can navigate through the pages in the report by either clicking on the pages listed below, or by using the keyword search tool below to find specific information within the annual report.-
 1
1 -
2
-
3
-
4
-
5
-
6
-
7
-
8
-
9
-
10
-
11
-
12
-
13
-
14
-
15
-
16
-
17
-
18
-
19
-
20
-
21
-
22
-
23
-
24
-
25
-
26
-
27
-
28
-
29
-
30
-
31
-
32
-
33
-
34
-
35
-
36
-
37
-
38
-
39
-
40
-
41
-
42
-
43
-
44
-
45
-
46
-
47
-
48
-
49
-
50
-
51
-
52
-
53
-
54
-
55
-
56
-
57
-
58
-
59
-
60
-
61
-
62
-
63
-
64
-
65
-
66
-
67
-
68
-
69
-
70
-
71
-
72
-
73
-
74
-
75
-
76
-
77
-
78
-
79
-
80
-
81
-
82
-
83
-
84
-
85
-
86
-
87
-
88
-
89
-
90
-
91
-
92
-
93
-
94
-
95
-
96
-
97
-
98
-
99
-
100
-
101
-
102
-
103
-
104
-
105
-
106
-
107
-
108
-
109
-
110
-
111
-
112
-
113
-
114
-
115
-
116
-
117
-
118
-
119
-
120
-
121
-
122
-
123
-
124
-
125
-
126
-
127
-
128
-
129
-
130
-
131
-
132
-
133
-
134
-
135
-
136
-
137
-
138
-
139
-
140
-
141
-
142
-
143
-
144
-
145
-
146
-
147
-
148
-
149
-
150
-
151
-
152
-
153
-
154
-
155
-
156
-
157
-
158
-
159
-
160
-
161
-
162
-
163
-
164
-
165
-
166
-
167
-
168
-
169
-
170
-
171
-
172
-
173
-
174
-
175
-
176
-
177
-
178
-
179
-
180
-
181
-
182
-
183
-
184
-
185
-
186
-
187
-
188
-
189
-
190
-
191
-
192
-
193
-
194
-
195
-
196
-
197
-
198
-
199
-
200
-
201
-
202
-
203
-
204
-
205
-
206
-
207
-
208
-
209
-
210
-
211
-
212
-
213
-
214
-
215
-
216
-
217
-
218
-
219
-
220
-
221
-
222
-
223
-
224
-
225
-
226
-
227
-
228
-
229
-
230
-
231
-
232
-
233
-
234
-
235
-
236
-
237
-
238
-
239
-
240
-
241
-
242
-
243
-
244
-
245
-
246
-
247
-
248
-
249
-
250
-
251
-
252
-
253
-
254
-
255
-
256
-
257
-
258
-
259
-
260
-
261
-
262
-
263
-
264
-
265
-
266
-
267
-
268
-
269
-
270
-
271
-
272
-
273
-
274
-
275
-
276
-
277
-
278
-
279
-
280
-
281
-
282
-
283
-
284
-
285
-
286
-
287
-
288
-
 289
289 -
 290
290 -
 291
291 -
 292
292 -
 293
293 -
 294
294 -
 295
295 -
 296
296 -
 297
297 -
 298
298 -
 299
299 -
 300
300 -
 301
301 -
 302
302 -
 303
303 -
 304
304 -
 305
305 -
 306
306 -
 307
307 -
 308
308 -
 309
309 -
310
-
311
-
312
-
313
-
314
-
315
-
316
-
317
-
318
-
319
-
320
-
321
-
322
-
323
-
324
-
325
-
326
-
327
-
328
-
329
-
330
-
331
-
332
-
333
-
334
-
335
-
336
-
337
-
338
-
339
-
340
-
341
-
342
-
343
-
344
-
345
-
346
-
347
-
348
-
349
-
350
-
351
-
352
-
353
-
354
-
355
-
356
-
357
-
358
-
359
-
360
-
361
-
362
-
363
-
364
-
365
-
366
-
367
-
368
-
369
-
370
-
371
-
372
-
373
-
374
-
375
-
376
-
377
-
378
-
379
-
380
-
381
-
382
-
383
-
384
-
385
-
386
-
387
-
388
-
389
-
390
-
391
-
392
-
393
-
394
-
395
-
396
-
397
-
398
-
399
-
400
-
401
-
402
-
403
-
404
-
405
-
406
-
407
-
408
-
409
-
410
-
411
-
412
-
413
-
414
-
415
-
416
-
417
-
418
-
419
-
420
-
421
-
422
-
423
-
424
 |
 |

297
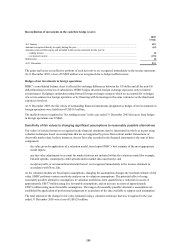
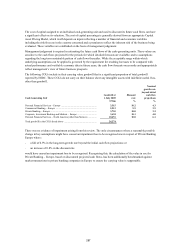
The cost of capital assigned to an individual cash-generating unit and used to discount its future cash flows can have
a significant effect on its valuation. The cost of capital percentage is generally derived from an appropriate Capital
Asset Pricing Model, which itself depends on inputs reflecting a number of financial and economic variables
including the risk-free rate in the country concerned and a premium to reflect the inherent risk of the business being
evaluated. These variables are established on the basis of management judgement.
Management judgement is required in estimating the future cash flows of the cash-generating units. These values are
sensitive to the cash flows projected for the periods for which detailed forecasts are available, and to assumptions
regarding the long-term sustainable pattern of cash flows thereafter. While the acceptable range within which
underlying assumptions can be applied is governed by the requirement for resulting forecasts to be compared with
actual performance and verifiable economic data in future years, the cash flow forecasts necessarily and appropriately
reflect management’s view of future business prospects.
The following CGUs include in their carrying value goodwill that is a significant proportion of total goodwill
reported by HSBC. These CGUs do not carry on their balance sheet any intangible assets with indefinite useful lives,
other than goodwill.
Cash Generating Unit
Goodwill at
1 July 2005
Discount
rate
Nominal
growth rate
beyond initial
cash flow
projections
US$m % %
Personal Financial Services – Europe ........................................................... 3,515 10.2 4.3
Commercial Banking – Europe .................................................................... 2,913 9.9 3.9
Private Banking – Europe ............................................................................. 3,701 10.0 3.2
Corporate, Investment Banking and Markets – Europe ................................ 3,694 10.1 4.0
Personal Financial Services – North America (other than Mexico) .............. 10,451 10.0 6.1
Total goodwill in the CGUs listed above ...................................................... 24,274
There was no evidence of impairment arising from this review. The only circumstances where a reasonably possible
change in key assumptions might have caused an impairment loss to be recognised was in respect of Private Banking
Europe where:
– a fall of 0.9% in the long-term growth rate beyond the initial cash flow projections; or
– an increase of 0.8% in the discount rate
would have caused an impairment loss to be recognised. Recognising this, the calculation of the value in use for
Private Banking – Europe, based on discounted projected cash flows, has been additionally benchmarked against
market transactions in private banking companies in Europe to ensure the carrying value is supportable.