HSBC 2005 Annual Report Download - page 165
Download and view the complete annual report
Please find page 165 of the 2005 HSBC annual report below. You can navigate through the pages in the report by either clicking on the pages listed below, or by using the keyword search tool below to find specific information within the annual report.-
 1
1 -
2
-
3
-
4
-
5
-
6
-
7
-
8
-
9
-
10
-
11
-
12
-
13
-
14
-
15
-
16
-
17
-
18
-
19
-
20
-
21
-
22
-
23
-
24
-
25
-
26
-
27
-
28
-
29
-
30
-
31
-
32
-
33
-
34
-
35
-
36
-
37
-
38
-
39
-
40
-
41
-
42
-
43
-
44
-
45
-
46
-
47
-
48
-
49
-
50
-
51
-
52
-
53
-
54
-
55
-
56
-
57
-
58
-
59
-
60
-
61
-
62
-
63
-
64
-
65
-
66
-
67
-
68
-
69
-
70
-
71
-
72
-
73
-
74
-
75
-
76
-
77
-
78
-
79
-
80
-
81
-
82
-
83
-
84
-
85
-
86
-
87
-
88
-
89
-
90
-
91
-
92
-
93
-
94
-
95
-
96
-
97
-
98
-
99
-
100
-
101
-
102
-
103
-
104
-
105
-
106
-
107
-
108
-
109
-
110
-
111
-
112
-
113
-
114
-
115
-
116
-
117
-
118
-
119
-
120
-
121
-
122
-
123
-
124
-
125
-
126
-
127
-
128
-
129
-
130
-
131
-
132
-
133
-
134
-
135
-
136
-
137
-
138
-
139
-
140
-
141
-
142
-
143
-
144
-
145
-
146
-
147
-
148
-
149
-
150
-
151
-
152
-
153
-
154
-
 155
155 -
 156
156 -
 157
157 -
 158
158 -
 159
159 -
 160
160 -
 161
161 -
 162
162 -
 163
163 -
 164
164 -
 165
165 -
 166
166 -
 167
167 -
 168
168 -
 169
169 -
 170
170 -
 171
171 -
 172
172 -
 173
173 -
 174
174 -
 175
175 -
176
-
177
-
178
-
179
-
180
-
181
-
182
-
183
-
184
-
185
-
186
-
187
-
188
-
189
-
190
-
191
-
192
-
193
-
194
-
195
-
196
-
197
-
198
-
199
-
200
-
201
-
202
-
203
-
204
-
205
-
206
-
207
-
208
-
209
-
210
-
211
-
212
-
213
-
214
-
215
-
216
-
217
-
218
-
219
-
220
-
221
-
222
-
223
-
224
-
225
-
226
-
227
-
228
-
229
-
230
-
231
-
232
-
233
-
234
-
235
-
236
-
237
-
238
-
239
-
240
-
241
-
242
-
243
-
244
-
245
-
246
-
247
-
248
-
249
-
250
-
251
-
252
-
253
-
254
-
255
-
256
-
257
-
258
-
259
-
260
-
261
-
262
-
263
-
264
-
265
-
266
-
267
-
268
-
269
-
270
-
271
-
272
-
273
-
274
-
275
-
276
-
277
-
278
-
279
-
280
-
281
-
282
-
283
-
284
-
285
-
286
-
287
-
288
-
289
-
290
-
291
-
292
-
293
-
294
-
295
-
296
-
297
-
298
-
299
-
300
-
301
-
302
-
303
-
304
-
305
-
306
-
307
-
308
-
309
-
310
-
311
-
312
-
313
-
314
-
315
-
316
-
317
-
318
-
319
-
320
-
321
-
322
-
323
-
324
-
325
-
326
-
327
-
328
-
329
-
330
-
331
-
332
-
333
-
334
-
335
-
336
-
337
-
338
-
339
-
340
-
341
-
342
-
343
-
344
-
345
-
346
-
347
-
348
-
349
-
350
-
351
-
352
-
353
-
354
-
355
-
356
-
357
-
358
-
359
-
360
-
361
-
362
-
363
-
364
-
365
-
366
-
367
-
368
-
369
-
370
-
371
-
372
-
373
-
374
-
375
-
376
-
377
-
378
-
379
-
380
-
381
-
382
-
383
-
384
-
385
-
386
-
387
-
388
-
389
-
390
-
391
-
392
-
393
-
394
-
395
-
396
-
397
-
398
-
399
-
400
-
401
-
402
-
403
-
404
-
405
-
406
-
407
-
408
-
409
-
410
-
411
-
412
-
413
-
414
-
415
-
416
-
417
-
418
-
419
-
420
-
421
-
422
-
423
-
424
 |
 |

163
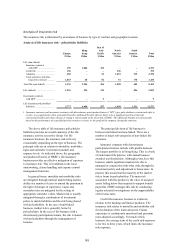
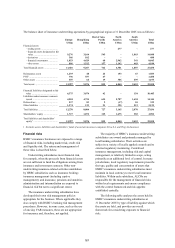
Analysis of insurance risk
The insurance risk is illustrated by an analysis of business by type of contract and geographic location.
Analysis of life insurance risk – policyholder liabilities
Europe
Hong
Kong
Rest of
Asia-
Pacific
North
America
South
America Tota l
US$m US$m US$m US$m US$m US$m
Life (non-linked)
Insurance contracts
with DPF1 .......................... 155 3,886 152 – – 4,193
Credit life .............................. 156 – –196 –352
Annuities ............................... 202 – 22 1,651 515 2,390
Term assurance and other
long-term contracts ........... 1,063 68 82 51 170 1,434
Total life (non-linked) ............... 1,576 3,954 256 1,898 685 8,369
Life (linked) .............................. 1,201 536 332 – 826 2,895
Investment contracts
with DPF1 .............................. ––9––9
Life insurance policyholders’
liabilities ................................ 2,777 4,490 597 1,898 1,511 11,273
1Insurance contracts and investment contracts with discretionary participation features (‘DPF’) give policyholders a contractual right to
receive, as a supplement to their guaranteed benefits, additional benefits that are likely to be a significant portion of the total
contractual benefits and whose amount or timing is contractually at the discretion of HSBC. The additional benefits are contractually
based on the performance of a specified pool of contracts or assets, or the profit of the company issuing the contracts.
The above table of life insurance policyholder
liabilities provides an overall summary of the life
insurance activity across the Group. For life
insurance business, the insurance risk will vary
considerably depending on the type of business. The
principal risks are in relation to mortality, morbidity,
lapse and surrender, investment (market) and
expense levels. As indicated above, the geographic
and product diversity of HSBC’s life insurance
business provides an effective mitigation of exposure
to insurance risk. This is in addition to the local
underwriting, claims handling and expense control
management functions.
In general terms, mortality and morbidity risks
are mitigated through medical underwriting and the
ability in a number of cases to amend the premium in
the light of changes in experience. Lapse and
surrender risks are mitigated by the setting of
appropriate surrender values. Market risk is usually
mitigated through a combination of investment
policy to match liabilities and the risk being shared
with policyholders. In the case of unit-linked
business, market risk is generally borne by
policyholders. In the case of life business with a
discretionary participation feature, the risk is shared
with policyholders through the management of
bonuses.
The principal division of life business is
between unit linked and non-linked. There are a
number of major sub-categories of non-linked life
assurance.
Insurance contracts with discretionary
participation features include with-profits business.
The largest portfolio is in Hong Kong. This is a book
of endowment life policies, with annual bonuses
awarded to policyholders. Although prima facie this
business entails significant market risk, this is
managed in conjunction with other risks through the
investment policy and adjustment to bonus rates. In
practice this means that the majority of the market
risk is borne by policyholders. The main risk
associated with this product is the value of assigned
assets falling below that required to support benefit
payments. HSBC manages this risk by conducting
regular actuarial investigations on the supportability
of the bonus rates.
Credit life insurance business is written in
relation to the banking and finance products. The
insurance risk relates to mortality and morbidity risk
for the duration of the loans advanced. Claims
experience is continuously monitored and premium
rates adjusted accordingly. For much of this
business, the average term of the credit risk exposure
is for two to three years, which limits the insurance
risk exposure.