HSBC 2005 Annual Report Download - page 89
Download and view the complete annual report
Please find page 89 of the 2005 HSBC annual report below. You can navigate through the pages in the report by either clicking on the pages listed below, or by using the keyword search tool below to find specific information within the annual report.-
 1
1 -
2
-
3
-
4
-
5
-
6
-
7
-
8
-
9
-
10
-
11
-
12
-
13
-
14
-
15
-
16
-
17
-
18
-
19
-
20
-
21
-
22
-
23
-
24
-
25
-
26
-
27
-
28
-
29
-
30
-
31
-
32
-
33
-
34
-
35
-
36
-
37
-
38
-
39
-
40
-
41
-
42
-
43
-
44
-
45
-
46
-
47
-
48
-
49
-
50
-
51
-
52
-
53
-
54
-
55
-
56
-
57
-
58
-
59
-
60
-
61
-
62
-
63
-
64
-
65
-
66
-
67
-
68
-
69
-
70
-
71
-
72
-
73
-
74
-
75
-
76
-
77
-
78
-
 79
79 -
 80
80 -
 81
81 -
 82
82 -
 83
83 -
 84
84 -
 85
85 -
 86
86 -
 87
87 -
 88
88 -
 89
89 -
 90
90 -
 91
91 -
 92
92 -
 93
93 -
 94
94 -
 95
95 -
 96
96 -
 97
97 -
 98
98 -
 99
99 -
100
-
101
-
102
-
103
-
104
-
105
-
106
-
107
-
108
-
109
-
110
-
111
-
112
-
113
-
114
-
115
-
116
-
117
-
118
-
119
-
120
-
121
-
122
-
123
-
124
-
125
-
126
-
127
-
128
-
129
-
130
-
131
-
132
-
133
-
134
-
135
-
136
-
137
-
138
-
139
-
140
-
141
-
142
-
143
-
144
-
145
-
146
-
147
-
148
-
149
-
150
-
151
-
152
-
153
-
154
-
155
-
156
-
157
-
158
-
159
-
160
-
161
-
162
-
163
-
164
-
165
-
166
-
167
-
168
-
169
-
170
-
171
-
172
-
173
-
174
-
175
-
176
-
177
-
178
-
179
-
180
-
181
-
182
-
183
-
184
-
185
-
186
-
187
-
188
-
189
-
190
-
191
-
192
-
193
-
194
-
195
-
196
-
197
-
198
-
199
-
200
-
201
-
202
-
203
-
204
-
205
-
206
-
207
-
208
-
209
-
210
-
211
-
212
-
213
-
214
-
215
-
216
-
217
-
218
-
219
-
220
-
221
-
222
-
223
-
224
-
225
-
226
-
227
-
228
-
229
-
230
-
231
-
232
-
233
-
234
-
235
-
236
-
237
-
238
-
239
-
240
-
241
-
242
-
243
-
244
-
245
-
246
-
247
-
248
-
249
-
250
-
251
-
252
-
253
-
254
-
255
-
256
-
257
-
258
-
259
-
260
-
261
-
262
-
263
-
264
-
265
-
266
-
267
-
268
-
269
-
270
-
271
-
272
-
273
-
274
-
275
-
276
-
277
-
278
-
279
-
280
-
281
-
282
-
283
-
284
-
285
-
286
-
287
-
288
-
289
-
290
-
291
-
292
-
293
-
294
-
295
-
296
-
297
-
298
-
299
-
300
-
301
-
302
-
303
-
304
-
305
-
306
-
307
-
308
-
309
-
310
-
311
-
312
-
313
-
314
-
315
-
316
-
317
-
318
-
319
-
320
-
321
-
322
-
323
-
324
-
325
-
326
-
327
-
328
-
329
-
330
-
331
-
332
-
333
-
334
-
335
-
336
-
337
-
338
-
339
-
340
-
341
-
342
-
343
-
344
-
345
-
346
-
347
-
348
-
349
-
350
-
351
-
352
-
353
-
354
-
355
-
356
-
357
-
358
-
359
-
360
-
361
-
362
-
363
-
364
-
365
-
366
-
367
-
368
-
369
-
370
-
371
-
372
-
373
-
374
-
375
-
376
-
377
-
378
-
379
-
380
-
381
-
382
-
383
-
384
-
385
-
386
-
387
-
388
-
389
-
390
-
391
-
392
-
393
-
394
-
395
-
396
-
397
-
398
-
399
-
400
-
401
-
402
-
403
-
404
-
405
-
406
-
407
-
408
-
409
-
410
-
411
-
412
-
413
-
414
-
415
-
416
-
417
-
418
-
419
-
420
-
421
-
422
-
423
-
424
 |
 |
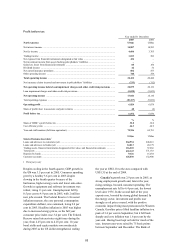
87
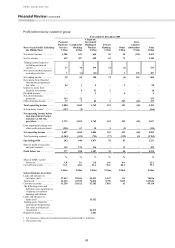
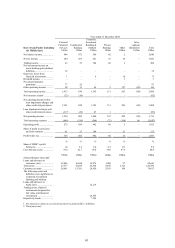
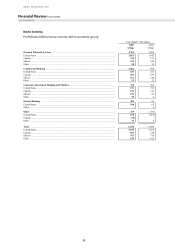
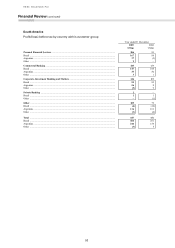
20 per cent market share and a near seven-fold
increase since December 2002. Strong sales of
insurance products resulted from increased cross-
selling through the branch network and combining
sales with other Personal Financial Services products
containing insurance components. Mutual fund
balances grew by 58 per cent, partly attributable to
the successful launch of new funds targeting
different market segments, along with strong cross-
sales among HSBC’s extensive customer base.
Trading income in 2005 was in line with 2004.
In the US mortgage banking business revenues
increased, largely as a result of more originations
and sales related income, which reflected improved
gains on each individual sale and a 41 per cent
increase in the volume of originated loans sold. In
addition, a higher percentage of ARM loans that
previously would have been held on balance sheet
were sold in 2005. This was partly offset by lower
gains on Decision One sales in the mortgage services
business.
The increase in other income was largely due to
the US. Losses from sales of properties repossessed
after customers default on their mortgage payments,
which are recorded as a reduction in other income,
were US$96 million lower than in 2004. This was
attributable to improvements in the process by which
fair market value is determined at the time of
repossession, and to a reduction in the number of
properties falling into repossession as credit quality
improved.
Loan impairment charges and other credit risk
provisions of US$5,086 million were marginally
lower than in 2004. In the US, charges were lower
notwithstanding the adverse effect of Hurricane
Katrina and higher bankruptcy filings following
changes in bankruptcy legislation. Partly offsetting
these impacts was the non-recurrence of
US$47 million charges from adopting Federal
Financial Institutions Examination Council charge-
off policies relating to retail and credit card balances
in 2004. Excluding these factors, the lower charge
reflected favourable credit conditions in the US.
Higher levels of secured lending, continued targeting
of higher credit quality customers and improvements
in underwriting contributed to the reduction. In
Mexico loan impairment charges rose in line with
higher lending volumes and the non-recurrence in
2005 of loan impairment provision releases in 2004,
while underlying credit quality remained stable. In
Canada, charges were in line with prior year, as
higher charges in the consumer lending business due
to loan growth were offset by provision releases in
the core bank business.
Operating expenses grew by 6 per cent to
US$7,382 million, largely in the US and Mexico. In
the US, costs increased by 3 per cent, as staff and
marketing costs rose in the consumer finance
business to support revenue growth. Acquisition
costs were incurred following the Metris purchase.
In the credit cards business, higher marketing spend
was incurred on the non-prime portfolios and
investment in new initiatives. Higher marketing
expenses were also incurred following changes in
contractual obligations associated with the General
Motors’ co-branded credit card portfolio in July
2004, but these were partly offset by improved
income through lower account origination fees.
In the US Bank, costs grew to support business
expansion and new branch openings. Brand
awareness programmes in the second and fourth
quarters increased marketing costs, and expenditure
was incurred on promoting the online savings
product. The benefit of these initiatives was reflected
in a significant increase in customer awareness of the
HSBC brand. Within the retail brokerage business,
cost increases reflected more stringent regulatory
requirements.
In Mexico, operating expenses grew by
21 per cent, driven by a combination of higher staff,
marketing and IT costs. Staff costs grew by
12 per cent, reflecting increases incurred to improve
customer service levels within the branch network
and bonus costs in line with increased sales.
Marketing costs grew to support the credit cards
business, evidenced by the 80 per cent increase in
the number of cards in circulation. IT costs rose as
new systems to meet Group standards, such as the
WHIRL credit card platform, were rolled out. In
Canada, operating expenses grew due to the opening
of new branches within the consumer finance
business, and expansion of the mortgage and credit
cards businesses.
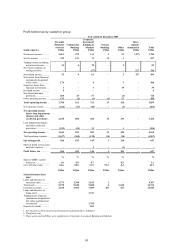
Commercial Banking’s pre-tax profits
increased by 23 per cent to US$1,064 million,
primarily due to lending growth and improved
liability interest spreads.
Net interest income increased by 23 per cent to
US$1,449 million. In the US, deposit growth,
particularly among small businesses, contributed to a
20 per cent increase in net interest income. The
recruitment of additional sales and support staff and
expansion on both the East and West coasts led to a
15 per cent increase in deposits and a 16 per cent
increase in lending balances, with income from
commercial real estate lending increasing by 27 per
cent. HSBC achieved particularly strong growth in
the SME market and maintained its market leading