HSBC 2005 Annual Report Download - page 178
Download and view the complete annual report
Please find page 178 of the 2005 HSBC annual report below. You can navigate through the pages in the report by either clicking on the pages listed below, or by using the keyword search tool below to find specific information within the annual report.-
 1
1 -
2
-
3
-
4
-
5
-
6
-
7
-
8
-
9
-
10
-
11
-
12
-
13
-
14
-
15
-
16
-
17
-
18
-
19
-
20
-
21
-
22
-
23
-
24
-
25
-
26
-
27
-
28
-
29
-
30
-
31
-
32
-
33
-
34
-
35
-
36
-
37
-
38
-
39
-
40
-
41
-
42
-
43
-
44
-
45
-
46
-
47
-
48
-
49
-
50
-
51
-
52
-
53
-
54
-
55
-
56
-
57
-
58
-
59
-
60
-
61
-
62
-
63
-
64
-
65
-
66
-
67
-
68
-
69
-
70
-
71
-
72
-
73
-
74
-
75
-
76
-
77
-
78
-
79
-
80
-
81
-
82
-
83
-
84
-
85
-
86
-
87
-
88
-
89
-
90
-
91
-
92
-
93
-
94
-
95
-
96
-
97
-
98
-
99
-
100
-
101
-
102
-
103
-
104
-
105
-
106
-
107
-
108
-
109
-
110
-
111
-
112
-
113
-
114
-
115
-
116
-
117
-
118
-
119
-
120
-
121
-
122
-
123
-
124
-
125
-
126
-
127
-
128
-
129
-
130
-
131
-
132
-
133
-
134
-
135
-
136
-
137
-
138
-
139
-
140
-
141
-
142
-
143
-
144
-
145
-
146
-
147
-
148
-
149
-
150
-
151
-
152
-
153
-
154
-
155
-
156
-
157
-
158
-
159
-
160
-
161
-
162
-
163
-
164
-
165
-
166
-
167
-
 168
168 -
 169
169 -
 170
170 -
 171
171 -
 172
172 -
 173
173 -
 174
174 -
 175
175 -
 176
176 -
 177
177 -
 178
178 -
 179
179 -
 180
180 -
 181
181 -
 182
182 -
 183
183 -
 184
184 -
 185
185 -
 186
186 -
 187
187 -
 188
188 -
189
-
190
-
191
-
192
-
193
-
194
-
195
-
196
-
197
-
198
-
199
-
200
-
201
-
202
-
203
-
204
-
205
-
206
-
207
-
208
-
209
-
210
-
211
-
212
-
213
-
214
-
215
-
216
-
217
-
218
-
219
-
220
-
221
-
222
-
223
-
224
-
225
-
226
-
227
-
228
-
229
-
230
-
231
-
232
-
233
-
234
-
235
-
236
-
237
-
238
-
239
-
240
-
241
-
242
-
243
-
244
-
245
-
246
-
247
-
248
-
249
-
250
-
251
-
252
-
253
-
254
-
255
-
256
-
257
-
258
-
259
-
260
-
261
-
262
-
263
-
264
-
265
-
266
-
267
-
268
-
269
-
270
-
271
-
272
-
273
-
274
-
275
-
276
-
277
-
278
-
279
-
280
-
281
-
282
-
283
-
284
-
285
-
286
-
287
-
288
-
289
-
290
-
291
-
292
-
293
-
294
-
295
-
296
-
297
-
298
-
299
-
300
-
301
-
302
-
303
-
304
-
305
-
306
-
307
-
308
-
309
-
310
-
311
-
312
-
313
-
314
-
315
-
316
-
317
-
318
-
319
-
320
-
321
-
322
-
323
-
324
-
325
-
326
-
327
-
328
-
329
-
330
-
331
-
332
-
333
-
334
-
335
-
336
-
337
-
338
-
339
-
340
-
341
-
342
-
343
-
344
-
345
-
346
-
347
-
348
-
349
-
350
-
351
-
352
-
353
-
354
-
355
-
356
-
357
-
358
-
359
-
360
-
361
-
362
-
363
-
364
-
365
-
366
-
367
-
368
-
369
-
370
-
371
-
372
-
373
-
374
-
375
-
376
-
377
-
378
-
379
-
380
-
381
-
382
-
383
-
384
-
385
-
386
-
387
-
388
-
389
-
390
-
391
-
392
-
393
-
394
-
395
-
396
-
397
-
398
-
399
-
400
-
401
-
402
-
403
-
404
-
405
-
406
-
407
-
408
-
409
-
410
-
411
-
412
-
413
-
414
-
415
-
416
-
417
-
418
-
419
-
420
-
421
-
422
-
423
-
424
 |
 |

HSBC HOLDINGS PLC
Financial Review (continued)
176
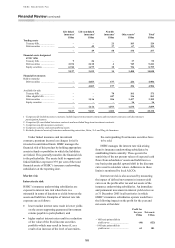
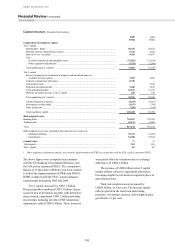
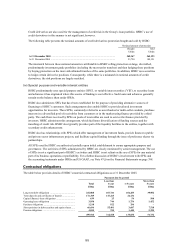
Capital structure (Unaudited information)
2005
US$m
2004
US$m
Composition of regulatory capital
Tier 1 capital
Shareholders’ funds ..................................................................................................................... 92,432 86,623
Minority interests and preference shares ..................................................................................... 6,741 4,253
Innovative tier 1 securities .......................................................................................................... 9,383 10,077
Less :
Goodwill capitalised and intangible assets .............................................................................. (32,821) (31,190)
Other regulatory adjustments1 ................................................................................................. (1,332) (2,504)
Total qualifying tier 1 capital ...................................................................................................... 74,403 67,259
Tier 2 capital
Reserves arising from revaluation of property and unrealised gains on
available-for-sale equities ....................................................................................................... 1,593 2,660
Collective impairment allowances ...............................................................................................8,749 –
General provisions ...................................................................................................................... –2,624
Perpetual subordinated debt ........................................................................................................ 3,640 3,670
Term subordinated debt ............................................................................................................... 24,519 21,373
Minority and other interests in tier 2 capital ................................................................................ 425 519
Total qualifying tier 2 capital ...................................................................................................... 38,926 30,846
Unconsolidated investments ........................................................................................................ (6,437) (6,361)
Investments in other banks .......................................................................................................... (1,147) (799)
Other deductions ......................................................................................................................... (296) (165)
Total regulatory capital ............................................................................................................... 105,449 90,780
Risk-weighted assets
Banking book .................................................................................................................................. 762,037 705,302
Trading book ................................................................................................................................... 65,127 53,908
Total ................................................................................................................................................ 827,164 759,210
Risk-weighted assets were included in the totals above in respect of:
– contingent liabilities ................................................................................................................. 43,333 41,264
– commitments ............................................................................................................................ 51,288 47,541
Capital ratios %%
Total capital ..................................................................................................................................... 12.8 12.0
Tier 1 capital ................................................................................................................................... 9.0 8.9
1Other regulatory adjustments mainly arise from the implementation of IFRSs in conjunction with the FSA’s policy statement PS05/5.
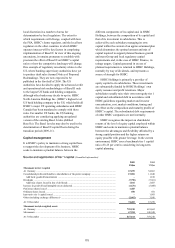
The above figures were computed in accordance
with the EU Banking Consolidation Directive and
the FSA policy statement PS05/5. The comparative
figures at 31 December 2004 have not been restated
to reflect the implementation of IFRSs and PS05/5.
HSBC complied with the FSA’s capital adequacy
requirements throughout 2005 and 2004.
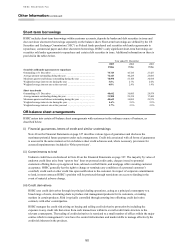
Tier 1 capital increased by US$7.1 billion.
Retained profits contributed US$7.3 billion, shares
issued in lieu of dividends, together with preference
shares issued, contributed US$3.2 billion and other
movements, including net other IFRS transitional
adjustments, added US$0.8 billion. These increases
were partly offset by reductions due to exchange
differences of US$4.2 billion.
The increase of US$8 billion in tier 2 capital
mainly reflects collective impairment allowances
becoming eligible for inclusion in capital in place of
general provisions.
Total risk-weighted assets increased by
US$68 billion, or 9 per cent. The increase mainly
reflects growth in the loan book and trading
positions. At constant currency, risk-weighted asset
growth was 13 per cent.