HSBC 2005 Annual Report Download - page 159
Download and view the complete annual report
Please find page 159 of the 2005 HSBC annual report below. You can navigate through the pages in the report by either clicking on the pages listed below, or by using the keyword search tool below to find specific information within the annual report.-
 1
1 -
2
-
3
-
4
-
5
-
6
-
7
-
8
-
9
-
10
-
11
-
12
-
13
-
14
-
15
-
16
-
17
-
18
-
19
-
20
-
21
-
22
-
23
-
24
-
25
-
26
-
27
-
28
-
29
-
30
-
31
-
32
-
33
-
34
-
35
-
36
-
37
-
38
-
39
-
40
-
41
-
42
-
43
-
44
-
45
-
46
-
47
-
48
-
49
-
50
-
51
-
52
-
53
-
54
-
55
-
56
-
57
-
58
-
59
-
60
-
61
-
62
-
63
-
64
-
65
-
66
-
67
-
68
-
69
-
70
-
71
-
72
-
73
-
74
-
75
-
76
-
77
-
78
-
79
-
80
-
81
-
82
-
83
-
84
-
85
-
86
-
87
-
88
-
89
-
90
-
91
-
92
-
93
-
94
-
95
-
96
-
97
-
98
-
99
-
100
-
101
-
102
-
103
-
104
-
105
-
106
-
107
-
108
-
109
-
110
-
111
-
112
-
113
-
114
-
115
-
116
-
117
-
118
-
119
-
120
-
121
-
122
-
123
-
124
-
125
-
126
-
127
-
128
-
129
-
130
-
131
-
132
-
133
-
134
-
135
-
136
-
137
-
138
-
139
-
140
-
141
-
142
-
143
-
144
-
145
-
146
-
147
-
148
-
 149
149 -
 150
150 -
 151
151 -
 152
152 -
 153
153 -
 154
154 -
 155
155 -
 156
156 -
 157
157 -
 158
158 -
 159
159 -
 160
160 -
 161
161 -
 162
162 -
 163
163 -
 164
164 -
 165
165 -
 166
166 -
 167
167 -
 168
168 -
 169
169 -
170
-
171
-
172
-
173
-
174
-
175
-
176
-
177
-
178
-
179
-
180
-
181
-
182
-
183
-
184
-
185
-
186
-
187
-
188
-
189
-
190
-
191
-
192
-
193
-
194
-
195
-
196
-
197
-
198
-
199
-
200
-
201
-
202
-
203
-
204
-
205
-
206
-
207
-
208
-
209
-
210
-
211
-
212
-
213
-
214
-
215
-
216
-
217
-
218
-
219
-
220
-
221
-
222
-
223
-
224
-
225
-
226
-
227
-
228
-
229
-
230
-
231
-
232
-
233
-
234
-
235
-
236
-
237
-
238
-
239
-
240
-
241
-
242
-
243
-
244
-
245
-
246
-
247
-
248
-
249
-
250
-
251
-
252
-
253
-
254
-
255
-
256
-
257
-
258
-
259
-
260
-
261
-
262
-
263
-
264
-
265
-
266
-
267
-
268
-
269
-
270
-
271
-
272
-
273
-
274
-
275
-
276
-
277
-
278
-
279
-
280
-
281
-
282
-
283
-
284
-
285
-
286
-
287
-
288
-
289
-
290
-
291
-
292
-
293
-
294
-
295
-
296
-
297
-
298
-
299
-
300
-
301
-
302
-
303
-
304
-
305
-
306
-
307
-
308
-
309
-
310
-
311
-
312
-
313
-
314
-
315
-
316
-
317
-
318
-
319
-
320
-
321
-
322
-
323
-
324
-
325
-
326
-
327
-
328
-
329
-
330
-
331
-
332
-
333
-
334
-
335
-
336
-
337
-
338
-
339
-
340
-
341
-
342
-
343
-
344
-
345
-
346
-
347
-
348
-
349
-
350
-
351
-
352
-
353
-
354
-
355
-
356
-
357
-
358
-
359
-
360
-
361
-
362
-
363
-
364
-
365
-
366
-
367
-
368
-
369
-
370
-
371
-
372
-
373
-
374
-
375
-
376
-
377
-
378
-
379
-
380
-
381
-
382
-
383
-
384
-
385
-
386
-
387
-
388
-
389
-
390
-
391
-
392
-
393
-
394
-
395
-
396
-
397
-
398
-
399
-
400
-
401
-
402
-
403
-
404
-
405
-
406
-
407
-
408
-
409
-
410
-
411
-
412
-
413
-
414
-
415
-
416
-
417
-
418
-
419
-
420
-
421
-
422
-
423
-
424
 |
 |
157
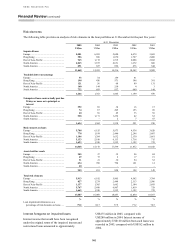
US$4.0 million), compared with US$3.7 million at
31 December 2004 (2004 average: US$3.9 million;
2004 minimum: US$2.8 million; 2004 maximum:
US$4.6 million).
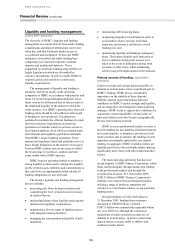
Non-trading exposure also arises on non-
cumulative perpetual preferred securities issued.
These fixed-rate securities are eligible as tier 1
capital and are managed as capital instruments. Prior
to the adoption of IFRSs these securities were
classified as a non-equity element of minority
interests but they are now classified as debt
securities issued and therefore included in non-
trading market risk analysis. The combination of a
fixed interest rate and perpetual term generated a
VAR of US$65.0 million at 31 December 2005
(2005 average: US$70.3 million; 2005 minimum:
US$62.3 million; 2005 maximum: US$78.2 million),
compared with US$72.5 million at 31 December
2004 (2004 average: US$75.6 million; 2004
minimum: US$66.6 million; 2004 maximum:
US$86.3 million).
Market risk arises in HSBC’s insurance
businesses within their portfolios of investments and
policyholders’ liabilities. The principal market risks
are interest-rate risk and equity risk, which primarily
arise when guaranteed investment return policies
have been issued. The insurance businesses have a
dedicated head office market risk function which
oversees management of this risk.
A similar market risk also arises within HSBC’s
defined benefit pension schemes to the extent that
the obligations of the schemes are not fully matched
by assets with determinable cash flows. This risk
principally derives from the pension schemes
holding equities against their future pension
obligations. The risk is that market movements in
equity prices could result in assets which are
insufficient over time to cover the level of projected
liabilities. Management, together with the trustees
who act on behalf of the pension scheme
beneficiaries, assess the level of this risk using
reports prepared by independent external actuaries.
The present value of HSBC’s defined benefit
pension plans’ liabilities was US$27.7 billion at
31 December 2005, compared with US$26.5 billion
at 31 December 2004. Assets of the defined benefit
schemes at 31 December 2005 comprised: equity
investments 46 per cent (54 per cent at 31 December
2004); debt securities 33 per cent (29 per cent at
31 December 2004) and other (including property)
21 per cent (17 per cent at 31 December 2004). (See
Note 7 on the Financial Statements).
Net interest income
A principal part of HSBC’s management of market
risk in non-trading portfolios is to monitor the
sensitivity of projected net interest income under
varying interest rate scenarios (simulation
modelling). HSBC aims, through its management of
market risk in non-trading portfolios, to mitigate the
impact of prospective interest rate movements which
could reduce future net interest income, whilst
balancing the cost of such hedging activities on the
current net revenue stream.
For simulation modelling, businesses use a
combination of scenarios relevant to local businesses
and local markets as well as standard scenarios
required to be used across HSBC. The standard
scenarios are consolidated to illustrate the combined
pro forma impact on HSBC consolidated portfolio
valuations and net interest income.
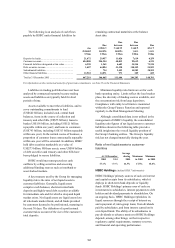
The table below sets out the impact on future net
interest income of a 25 basis points parallel fall or
rise in all yield curves worldwide at the beginning of
each quarter during the 12 month period from 1
January 2006. These scenarios differ from those
disclosed in the Annual Report and Accounts 2004
which assumed an immediate 100 basis points
parallel rise or fall in all yield curves on the first day
of the 12 month period. The revised scenarios,
although still simplified, are considered more
relevant.
Assuming no management actions, such a series
of incremental parallel rises in all yield curves would
decrease planned net interest income for the year to
31 December 2006 by US$525 million, while such a
series of incremental parallel falls in all yield curves
would increase planned net interest income by
US$474 million. These figures incorporate the
impact of any option features in the underlying
exposures.
Instead of assuming that all interest rates move
together, HSBC groups its interest rate exposures
into currency blocs whose interest rates are
considered likely to move together. The sensitivity of
projected net interest income, on this basis, is
described as follows: