HSBC 2005 Annual Report Download - page 63
Download and view the complete annual report
Please find page 63 of the 2005 HSBC annual report below. You can navigate through the pages in the report by either clicking on the pages listed below, or by using the keyword search tool below to find specific information within the annual report.-
 1
1 -
2
-
3
-
4
-
5
-
6
-
7
-
8
-
9
-
10
-
11
-
12
-
13
-
14
-
15
-
16
-
17
-
18
-
19
-
20
-
21
-
22
-
23
-
24
-
25
-
26
-
27
-
28
-
29
-
30
-
31
-
32
-
33
-
34
-
35
-
36
-
37
-
38
-
39
-
40
-
41
-
42
-
43
-
44
-
45
-
46
-
47
-
48
-
49
-
50
-
51
-
52
-
 53
53 -
 54
54 -
 55
55 -
 56
56 -
 57
57 -
 58
58 -
 59
59 -
 60
60 -
 61
61 -
 62
62 -
 63
63 -
 64
64 -
 65
65 -
 66
66 -
 67
67 -
 68
68 -
 69
69 -
 70
70 -
 71
71 -
 72
72 -
 73
73 -
74
-
75
-
76
-
77
-
78
-
79
-
80
-
81
-
82
-
83
-
84
-
85
-
86
-
87
-
88
-
89
-
90
-
91
-
92
-
93
-
94
-
95
-
96
-
97
-
98
-
99
-
100
-
101
-
102
-
103
-
104
-
105
-
106
-
107
-
108
-
109
-
110
-
111
-
112
-
113
-
114
-
115
-
116
-
117
-
118
-
119
-
120
-
121
-
122
-
123
-
124
-
125
-
126
-
127
-
128
-
129
-
130
-
131
-
132
-
133
-
134
-
135
-
136
-
137
-
138
-
139
-
140
-
141
-
142
-
143
-
144
-
145
-
146
-
147
-
148
-
149
-
150
-
151
-
152
-
153
-
154
-
155
-
156
-
157
-
158
-
159
-
160
-
161
-
162
-
163
-
164
-
165
-
166
-
167
-
168
-
169
-
170
-
171
-
172
-
173
-
174
-
175
-
176
-
177
-
178
-
179
-
180
-
181
-
182
-
183
-
184
-
185
-
186
-
187
-
188
-
189
-
190
-
191
-
192
-
193
-
194
-
195
-
196
-
197
-
198
-
199
-
200
-
201
-
202
-
203
-
204
-
205
-
206
-
207
-
208
-
209
-
210
-
211
-
212
-
213
-
214
-
215
-
216
-
217
-
218
-
219
-
220
-
221
-
222
-
223
-
224
-
225
-
226
-
227
-
228
-
229
-
230
-
231
-
232
-
233
-
234
-
235
-
236
-
237
-
238
-
239
-
240
-
241
-
242
-
243
-
244
-
245
-
246
-
247
-
248
-
249
-
250
-
251
-
252
-
253
-
254
-
255
-
256
-
257
-
258
-
259
-
260
-
261
-
262
-
263
-
264
-
265
-
266
-
267
-
268
-
269
-
270
-
271
-
272
-
273
-
274
-
275
-
276
-
277
-
278
-
279
-
280
-
281
-
282
-
283
-
284
-
285
-
286
-
287
-
288
-
289
-
290
-
291
-
292
-
293
-
294
-
295
-
296
-
297
-
298
-
299
-
300
-
301
-
302
-
303
-
304
-
305
-
306
-
307
-
308
-
309
-
310
-
311
-
312
-
313
-
314
-
315
-
316
-
317
-
318
-
319
-
320
-
321
-
322
-
323
-
324
-
325
-
326
-
327
-
328
-
329
-
330
-
331
-
332
-
333
-
334
-
335
-
336
-
337
-
338
-
339
-
340
-
341
-
342
-
343
-
344
-
345
-
346
-
347
-
348
-
349
-
350
-
351
-
352
-
353
-
354
-
355
-
356
-
357
-
358
-
359
-
360
-
361
-
362
-
363
-
364
-
365
-
366
-
367
-
368
-
369
-
370
-
371
-
372
-
373
-
374
-
375
-
376
-
377
-
378
-
379
-
380
-
381
-
382
-
383
-
384
-
385
-
386
-
387
-
388
-
389
-
390
-
391
-
392
-
393
-
394
-
395
-
396
-
397
-
398
-
399
-
400
-
401
-
402
-
403
-
404
-
405
-
406
-
407
-
408
-
409
-
410
-
411
-
412
-
413
-
414
-
415
-
416
-
417
-
418
-
419
-
420
-
421
-
422
-
423
-
424
 |
 |
61
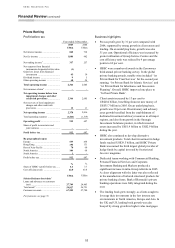
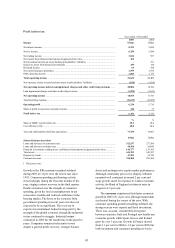
Commercial Banking customers with the most
experienced relationship managers, led to a 10 per
cent increase in medium term loan balances. Sight
deposit balances grew by 7 per cent, though deposit
spreads decreased as maturing funds were placed at
lower prevailing interest rates.
Net fee income increased by 2 per cent to
US$1,621 million, net of IFRSs changes to switch
some fees into the effective interest rate calculation,
which led to a 15 per cent reduction in fee income.
In the UK, higher new business volumes and lending
activity contributed to a US$77 million, or 27 per
cent, increase in loan and overdraft fee income.
Increased customer numbers, coupled with the
introduction of a new small business tariff in January
2005, led to a 13 per cent increase in current account
fee income. Card acquiring income increased by
8 per cent, despite a slowdown in consumer
spending driven by a 6 per cent increase in
transaction volumes, reflecting merchant acquisition.
A 21 per cent increase in card customer numbers
contributed to higher card issuing income.
HSBC benefited from the recruitment of
additional sales staff, development of profitable
relationships with brokers and the success of
dedicated corporate and commercial centres. Invoice
financing fee income increased by 9 per cent,
benefiting from an expanded client base, while a
tariff review contributed to a 16 per cent increase in
treasury income. The recruitment, in both 2004 and
2005, of commercial independent financial advisors,
together with the development of existing sales staff,
led to a 13 per cent increase in insurance and
investment income, with fee income from savings
and investment products increasing by a third.
Income in the vehicle and equipment leasing
businesses decreased by 13 per cent, following an
agreement to outsource the operational functions of
the UK vehicle finance contract hire business to Lex
Vehicle Leasing, which took effect from November
2005. Excluding the transfer, net fee income from
leasing increased by 5 per cent.
Loan impairment charges and other credit risk
provisions increased by 26 per cent to
US$378 million. In the UK, lending growth and
sizeable allowances against a small number of
accounts led to a US$162 million increase in
charges. Overall credit quality remained relatively
strong, although some deterioration was evident in
the market in the last three months of 2005 as
consumer spending declined. In France, new
individually assessed allowances were largely offset
by higher recoveries, while in Malta net releases
decreased as a large release against a single customer
in 2004 was not repeated.
Operating expenses decreased by 5 per cent and,
together with increased income, resulted in a
6 percentage point improvement in the cost
efficiency ratio. In the UK, the non-recurrence of
cost reduction expenditure in 2004, together with the
resulting fall in staff numbers and strong cost
control, contributed to a 10 per cent decrease in
operating expenses. Although overall staff numbers
declined, additional sales staff were hired to take
advantage of business opportunities in support of
revenue growth. These sales staff were supported by
press and other advertising campaigns aimed at
attracting customers switching banks and start-up
businesses to HSBC, together with a campaign
targeting SMEs which contributed to an increase in
marketing costs.
In France, staff recruitment, increased marketing
activity and re-branding led to an 8 per cent increase
in costs. Staff costs rose as HSBC France recruited
additional sales staff to support business expansion,
and success led to higher performance-related
remuneration. Campaigns targeting top tier
commercial customers and supporting product
launches led to an increase in marketing expenditure,
while rebranding and supporting activity to
emphasise the ‘HSBC’ name change also
contributed.
In an economy which grew by 5.5 per cent in
2005, increased business activity, the launch of SME
banking and the recruitment of additional sales and
support staff in Turkey contributed to a rise in
income and a 17 per cent increase in operating
expenses.
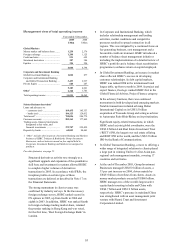
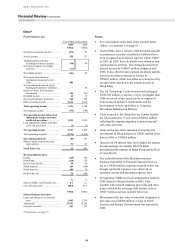
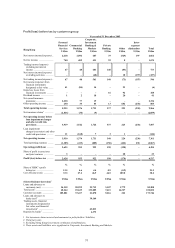
Corporate, Investment Banking and Markets
reported a pre-tax profit of US$2,114 million, an
increase of 27 per cent, compared with 2004.
Revenues from all major client-related trading
activities increased, particularly from the credit and
rates, equities and structured derivatives businesses
where HSBC has invested in upgrading its
capabilities. Operating expenses rose, reflecting the
first full-year cost of the expanded sales and
execution capabilities. However, cost growth slowed
in the second half of 2005 and in aggregate in
Europe, revenue growth comfortably surpassed
growth in costs. In Europe, 2005 marked the
transition from the investment phase of Corporate,
Investment Banking and Markets’ development
strategy to a focus on implementation.
Total operating income increased by 15 per cent
to US$5,510 million. Balance sheet management and
money market revenues declined by approximately
46 per cent reflecting a challenging interest rate