HSBC 2005 Annual Report Download - page 264
Download and view the complete annual report
Please find page 264 of the 2005 HSBC annual report below. You can navigate through the pages in the report by either clicking on the pages listed below, or by using the keyword search tool below to find specific information within the annual report.-
 1
1 -
2
-
3
-
4
-
5
-
6
-
7
-
8
-
9
-
10
-
11
-
12
-
13
-
14
-
15
-
16
-
17
-
18
-
19
-
20
-
21
-
22
-
23
-
24
-
25
-
26
-
27
-
28
-
29
-
30
-
31
-
32
-
33
-
34
-
35
-
36
-
37
-
38
-
39
-
40
-
41
-
42
-
43
-
44
-
45
-
46
-
47
-
48
-
49
-
50
-
51
-
52
-
53
-
54
-
55
-
56
-
57
-
58
-
59
-
60
-
61
-
62
-
63
-
64
-
65
-
66
-
67
-
68
-
69
-
70
-
71
-
72
-
73
-
74
-
75
-
76
-
77
-
78
-
79
-
80
-
81
-
82
-
83
-
84
-
85
-
86
-
87
-
88
-
89
-
90
-
91
-
92
-
93
-
94
-
95
-
96
-
97
-
98
-
99
-
100
-
101
-
102
-
103
-
104
-
105
-
106
-
107
-
108
-
109
-
110
-
111
-
112
-
113
-
114
-
115
-
116
-
117
-
118
-
119
-
120
-
121
-
122
-
123
-
124
-
125
-
126
-
127
-
128
-
129
-
130
-
131
-
132
-
133
-
134
-
135
-
136
-
137
-
138
-
139
-
140
-
141
-
142
-
143
-
144
-
145
-
146
-
147
-
148
-
149
-
150
-
151
-
152
-
153
-
154
-
155
-
156
-
157
-
158
-
159
-
160
-
161
-
162
-
163
-
164
-
165
-
166
-
167
-
168
-
169
-
170
-
171
-
172
-
173
-
174
-
175
-
176
-
177
-
178
-
179
-
180
-
181
-
182
-
183
-
184
-
185
-
186
-
187
-
188
-
189
-
190
-
191
-
192
-
193
-
194
-
195
-
196
-
197
-
198
-
199
-
200
-
201
-
202
-
203
-
204
-
205
-
206
-
207
-
208
-
209
-
210
-
211
-
212
-
213
-
214
-
215
-
216
-
217
-
218
-
219
-
220
-
221
-
222
-
223
-
224
-
225
-
226
-
227
-
228
-
229
-
230
-
231
-
232
-
233
-
234
-
235
-
236
-
237
-
238
-
239
-
240
-
241
-
242
-
243
-
244
-
245
-
246
-
247
-
248
-
249
-
250
-
251
-
252
-
253
-
 254
254 -
 255
255 -
 256
256 -
 257
257 -
 258
258 -
 259
259 -
 260
260 -
 261
261 -
 262
262 -
 263
263 -
 264
264 -
 265
265 -
 266
266 -
 267
267 -
 268
268 -
 269
269 -
 270
270 -
 271
271 -
 272
272 -
 273
273 -
 274
274 -
275
-
276
-
277
-
278
-
279
-
280
-
281
-
282
-
283
-
284
-
285
-
286
-
287
-
288
-
289
-
290
-
291
-
292
-
293
-
294
-
295
-
296
-
297
-
298
-
299
-
300
-
301
-
302
-
303
-
304
-
305
-
306
-
307
-
308
-
309
-
310
-
311
-
312
-
313
-
314
-
315
-
316
-
317
-
318
-
319
-
320
-
321
-
322
-
323
-
324
-
325
-
326
-
327
-
328
-
329
-
330
-
331
-
332
-
333
-
334
-
335
-
336
-
337
-
338
-
339
-
340
-
341
-
342
-
343
-
344
-
345
-
346
-
347
-
348
-
349
-
350
-
351
-
352
-
353
-
354
-
355
-
356
-
357
-
358
-
359
-
360
-
361
-
362
-
363
-
364
-
365
-
366
-
367
-
368
-
369
-
370
-
371
-
372
-
373
-
374
-
375
-
376
-
377
-
378
-
379
-
380
-
381
-
382
-
383
-
384
-
385
-
386
-
387
-
388
-
389
-
390
-
391
-
392
-
393
-
394
-
395
-
396
-
397
-
398
-
399
-
400
-
401
-
402
-
403
-
404
-
405
-
406
-
407
-
408
-
409
-
410
-
411
-
412
-
413
-
414
-
415
-
416
-
417
-
418
-
419
-
420
-
421
-
422
-
423
-
424
 |
 |

HSBC HOLDINGS PLC
Notes on the Financial Statements (continued)
262
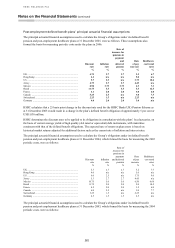
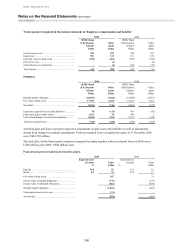
Post-employment defined benefit plans’ principal actuarial financial assumptions
The principal actuarial financial assumptions used to calculate the Group’s obligations under its defined benefit
pension and post-employment healthcare plans at 31 December 2005, were as follows. These assumptions also
formed the basis for measuring periodic costs under the plans in 2006:
Discount
rate
Inflation
rate
Rate of
increase for
pensions in
payment
and
deferred
pension
Rate
of pay
increase
Healthcare
cost trend
rates
%%%%%
UK .................................................................................... 4.75 2.7 2.7 3.2 6.7
Hong Kong ....................................................................... 4.2 n/a n/a 5.0 n/a
US .................................................................................... 5.7 2.5 n/a 3.75 10.4
Jersey ................................................................................ 4.75 2.7 2.7 4.45 n/a
Mexico ............................................................................. 8.90 3.75 3.75 4.5 7.3
Brazil ................................................................................ 11.75 5.5 5.5 5.5 12.5
France ............................................................................... 4.1 2.0 2.0 3.0 6.0
Canada ............................................................................. 5.25 2.5 n/a 3.0 7.3
Switzerland ....................................................................... 2.25 1.5 n/a 2.25 n/a
Germany ........................................................................... 4.0 2.0 2.0 3.0 n/a
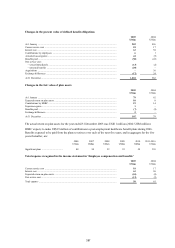
HSBC calculates that a 25 basis point change in the discount rate used for the HSBC Bank (UK) Pension Scheme as
at 31 December 2005 would result in a change in the plan’s defined benefit obligation of approximately 5 per cent or
US$1,030 million.
HSBC determines the discount rates to be applied to its obligations in consultation with the plans’ local actuaries, on
the basis of current average yields of high quality (AA rated or equivalent) debt instruments, with maturities
consistent with that of the defined benefit obligations. The expected rate of return on plan assets is based on
historical market returns adjusted for additional factors such as the current rate of inflation and interest rates.
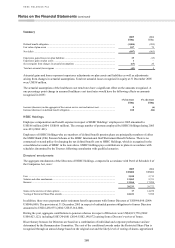
The principal actuarial financial assumptions used to calculate the Group’s obligations under its defined benefit
pension and post-employment healthcare plans at 31 December 2004, which formed the basis for measuring the 2005
periodic costs, were as follows:
Discount
rate
Inflation
rate
Rate of
increase for
pensions in
payment
and deferred
pension
Rate
of pay
increase
Healthcare
cost trend
rates
%%%%%
UK .................................................................................... 5.3 2.7 2.7 3.2 7.7
Hong Kong ....................................................................... 4.0 n/a n/a 5.0 n/a
US .................................................................................... 6.0 2.5 n/a 3.75 9.0
Jersey ................................................................................ 5.3 2.7 2.7 4.45 n/a
Mexico ............................................................................. 10.75 5.0 5.0 6.50 8.68
Brazil ................................................................................ 11.75 5.0 5.0 5.0 10.5
France ............................................................................... 4.5 2.0 2.0 3.5 6.0
Canada ............................................................................. 6.0 2.5 n/a 3.0 7.7
Switzerland ....................................................................... 3.25 1.5 n/a 2.25 n/a
Germany ........................................................................... 4.5 1.5 1.5 2.5 n/a
The principal actuarial financial assumptions used to calculate the Group’s obligations under its defined benefit
pension and post-employment healthcare plans at 31 December 2003, which formed the basis for measuring the 2004
periodic costs, were as follows: