HSBC 2005 Annual Report Download - page 262
Download and view the complete annual report
Please find page 262 of the 2005 HSBC annual report below. You can navigate through the pages in the report by either clicking on the pages listed below, or by using the keyword search tool below to find specific information within the annual report.-
 1
1 -
2
-
3
-
4
-
5
-
6
-
7
-
8
-
9
-
10
-
11
-
12
-
13
-
14
-
15
-
16
-
17
-
18
-
19
-
20
-
21
-
22
-
23
-
24
-
25
-
26
-
27
-
28
-
29
-
30
-
31
-
32
-
33
-
34
-
35
-
36
-
37
-
38
-
39
-
40
-
41
-
42
-
43
-
44
-
45
-
46
-
47
-
48
-
49
-
50
-
51
-
52
-
53
-
54
-
55
-
56
-
57
-
58
-
59
-
60
-
61
-
62
-
63
-
64
-
65
-
66
-
67
-
68
-
69
-
70
-
71
-
72
-
73
-
74
-
75
-
76
-
77
-
78
-
79
-
80
-
81
-
82
-
83
-
84
-
85
-
86
-
87
-
88
-
89
-
90
-
91
-
92
-
93
-
94
-
95
-
96
-
97
-
98
-
99
-
100
-
101
-
102
-
103
-
104
-
105
-
106
-
107
-
108
-
109
-
110
-
111
-
112
-
113
-
114
-
115
-
116
-
117
-
118
-
119
-
120
-
121
-
122
-
123
-
124
-
125
-
126
-
127
-
128
-
129
-
130
-
131
-
132
-
133
-
134
-
135
-
136
-
137
-
138
-
139
-
140
-
141
-
142
-
143
-
144
-
145
-
146
-
147
-
148
-
149
-
150
-
151
-
152
-
153
-
154
-
155
-
156
-
157
-
158
-
159
-
160
-
161
-
162
-
163
-
164
-
165
-
166
-
167
-
168
-
169
-
170
-
171
-
172
-
173
-
174
-
175
-
176
-
177
-
178
-
179
-
180
-
181
-
182
-
183
-
184
-
185
-
186
-
187
-
188
-
189
-
190
-
191
-
192
-
193
-
194
-
195
-
196
-
197
-
198
-
199
-
200
-
201
-
202
-
203
-
204
-
205
-
206
-
207
-
208
-
209
-
210
-
211
-
212
-
213
-
214
-
215
-
216
-
217
-
218
-
219
-
220
-
221
-
222
-
223
-
224
-
225
-
226
-
227
-
228
-
229
-
230
-
231
-
232
-
233
-
234
-
235
-
236
-
237
-
238
-
239
-
240
-
241
-
242
-
243
-
244
-
245
-
246
-
247
-
248
-
249
-
250
-
251
-
 252
252 -
 253
253 -
 254
254 -
 255
255 -
 256
256 -
 257
257 -
 258
258 -
 259
259 -
 260
260 -
 261
261 -
 262
262 -
 263
263 -
 264
264 -
 265
265 -
 266
266 -
 267
267 -
 268
268 -
 269
269 -
 270
270 -
 271
271 -
 272
272 -
273
-
274
-
275
-
276
-
277
-
278
-
279
-
280
-
281
-
282
-
283
-
284
-
285
-
286
-
287
-
288
-
289
-
290
-
291
-
292
-
293
-
294
-
295
-
296
-
297
-
298
-
299
-
300
-
301
-
302
-
303
-
304
-
305
-
306
-
307
-
308
-
309
-
310
-
311
-
312
-
313
-
314
-
315
-
316
-
317
-
318
-
319
-
320
-
321
-
322
-
323
-
324
-
325
-
326
-
327
-
328
-
329
-
330
-
331
-
332
-
333
-
334
-
335
-
336
-
337
-
338
-
339
-
340
-
341
-
342
-
343
-
344
-
345
-
346
-
347
-
348
-
349
-
350
-
351
-
352
-
353
-
354
-
355
-
356
-
357
-
358
-
359
-
360
-
361
-
362
-
363
-
364
-
365
-
366
-
367
-
368
-
369
-
370
-
371
-
372
-
373
-
374
-
375
-
376
-
377
-
378
-
379
-
380
-
381
-
382
-
383
-
384
-
385
-
386
-
387
-
388
-
389
-
390
-
391
-
392
-
393
-
394
-
395
-
396
-
397
-
398
-
399
-
400
-
401
-
402
-
403
-
404
-
405
-
406
-
407
-
408
-
409
-
410
-
411
-
412
-
413
-
414
-
415
-
416
-
417
-
418
-
419
-
420
-
421
-
422
-
423
-
424
 |
 |

HSBC HOLDINGS PLC
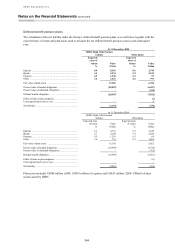
Notes on the Financial Statements (continued)
260
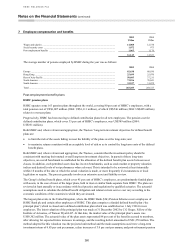
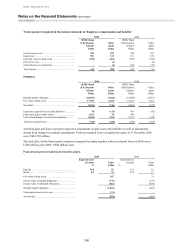
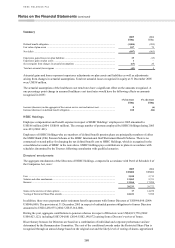
7 Employee compensation and benefits
2005 2004
US$m US$m
Wages and salaries ......................................................................................................................... 14,008 12,374
Social security costs ....................................................................................................................... 1,072 973
Post-employment benefits .............................................................................................................. 1,065 1,176
16,145 14,523
The average number of persons employed by HSBC during the year was as follows:
2005 2004
Europe ............................................................................................................................................ 82,638 80,930
Hong Kong ..................................................................................................................................... 25,699 25,070
Rest of Asia-Pacific ........................................................................................................................ 50,605 37,211
North America ................................................................................................................................ 73,816 70,041
South America ................................................................................................................................ 32,527 31,475
Total ............................................................................................................................................... 265,285 244,727
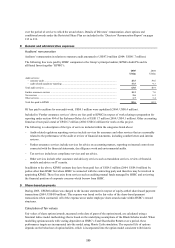
Post-employment benefit plans
HSBC pension plans
HSBC operates some 163 pension plans throughout the world, covering 80 per cent of HSBC’s employees, with a
total pension cost of US$1,007 million (2004: US$1,111 million), of which US$546 million (2004: US$485 million)
relates to overseas plans.
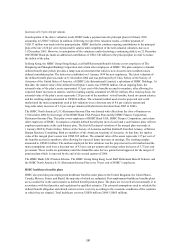
Progressively, HSBC has been moving to defined contribution plans for all new employees. The pension cost for
defined contribution plans, which cover 35 per cent of HSBC’s employees, was US$389 million (2004:
US$351 million).
Both HSBC and, where relevant and appropriate, the Trustees’ long-term investment objectives for defined benefit
plans are:
• to limit the risk of the assets failing to meet the liability of the plans over the long-term; and
• to maximise returns consistent with an acceptable level of risk so as to control the long-term costs of the defined
benefit plans.
Both HSBC and, where relevant and appropriate, the Trustees, consider that the investment policy should be
consistent with meeting their mutual overall long-term investment objectives. In pursuit of these long-term
objectives, an overall benchmark is established for the allocation of the defined benefit plan assets between asset
classes. In addition, each permitted asset class has its own benchmarks, such as stock market or property valuation
indices and desired levels of out performance where relevant. This is intended to be reviewed at least triennially
within 18 months of the date at which the actual valuation is made, or more frequently if circumstances or local
legislation so require. The process generally involves an extensive asset and liability review.
The Group’s defined benefit plans, which cover 45 per cent of HSBC’s employees, are predominantly funded plans
with assets, in the case of most of the larger plans, held in trust or similar funds separate from HSBC. The plans are
reviewed at least annually or in accordance with local practice and regulations by qualified actuaries. The actuarial
assumptions used to calculate the defined benefit obligation and related current service cost vary according to the
economic conditions of the countries in which they are situated.
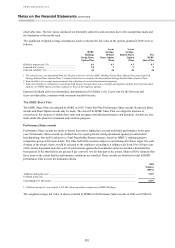
The largest plan exists in the United Kingdom, where the HSBC Bank (UK) Pension Scheme covers employees of
HSBC Bank plc and certain other employees of HSBC. This plan comprises a funded defined benefit plan (‘the
principal plan’) which is closed and a defined contribution plan which was established on 1 July 1996 for new
employees. The latest valuation of the principal plan was made at 31 December 2002 by C G Singer, Fellow of the
Institute of Actuaries, of Watson Wyatt LLP. At that date, the market value of the principal plan’s assets was
US$9,302 million. The actuarial value of the plan assets represented 88 per cent of the benefits accrued to members,
after allowing for expected future increases in earnings, and the resulting deficit amounted to US$1,270 million. The
method adopted for this valuation was the projected unit method and the main assumptions used were a long-term
investment return of 6.85 per cent per annum, salary increases of 3.0 per cent per annum, and post-retirement pension