HSBC 2005 Annual Report Download - page 86
Download and view the complete annual report
Please find page 86 of the 2005 HSBC annual report below. You can navigate through the pages in the report by either clicking on the pages listed below, or by using the keyword search tool below to find specific information within the annual report.-
 1
1 -
2
-
3
-
4
-
5
-
6
-
7
-
8
-
9
-
10
-
11
-
12
-
13
-
14
-
15
-
16
-
17
-
18
-
19
-
20
-
21
-
22
-
23
-
24
-
25
-
26
-
27
-
28
-
29
-
30
-
31
-
32
-
33
-
34
-
35
-
36
-
37
-
38
-
39
-
40
-
41
-
42
-
43
-
44
-
45
-
46
-
47
-
48
-
49
-
50
-
51
-
52
-
53
-
54
-
55
-
56
-
57
-
58
-
59
-
60
-
61
-
62
-
63
-
64
-
65
-
66
-
67
-
68
-
69
-
70
-
71
-
72
-
73
-
74
-
75
-
 76
76 -
 77
77 -
 78
78 -
 79
79 -
 80
80 -
 81
81 -
 82
82 -
 83
83 -
 84
84 -
 85
85 -
 86
86 -
 87
87 -
 88
88 -
 89
89 -
 90
90 -
 91
91 -
 92
92 -
 93
93 -
 94
94 -
 95
95 -
 96
96 -
97
-
98
-
99
-
100
-
101
-
102
-
103
-
104
-
105
-
106
-
107
-
108
-
109
-
110
-
111
-
112
-
113
-
114
-
115
-
116
-
117
-
118
-
119
-
120
-
121
-
122
-
123
-
124
-
125
-
126
-
127
-
128
-
129
-
130
-
131
-
132
-
133
-
134
-
135
-
136
-
137
-
138
-
139
-
140
-
141
-
142
-
143
-
144
-
145
-
146
-
147
-
148
-
149
-
150
-
151
-
152
-
153
-
154
-
155
-
156
-
157
-
158
-
159
-
160
-
161
-
162
-
163
-
164
-
165
-
166
-
167
-
168
-
169
-
170
-
171
-
172
-
173
-
174
-
175
-
176
-
177
-
178
-
179
-
180
-
181
-
182
-
183
-
184
-
185
-
186
-
187
-
188
-
189
-
190
-
191
-
192
-
193
-
194
-
195
-
196
-
197
-
198
-
199
-
200
-
201
-
202
-
203
-
204
-
205
-
206
-
207
-
208
-
209
-
210
-
211
-
212
-
213
-
214
-
215
-
216
-
217
-
218
-
219
-
220
-
221
-
222
-
223
-
224
-
225
-
226
-
227
-
228
-
229
-
230
-
231
-
232
-
233
-
234
-
235
-
236
-
237
-
238
-
239
-
240
-
241
-
242
-
243
-
244
-
245
-
246
-
247
-
248
-
249
-
250
-
251
-
252
-
253
-
254
-
255
-
256
-
257
-
258
-
259
-
260
-
261
-
262
-
263
-
264
-
265
-
266
-
267
-
268
-
269
-
270
-
271
-
272
-
273
-
274
-
275
-
276
-
277
-
278
-
279
-
280
-
281
-
282
-
283
-
284
-
285
-
286
-
287
-
288
-
289
-
290
-
291
-
292
-
293
-
294
-
295
-
296
-
297
-
298
-
299
-
300
-
301
-
302
-
303
-
304
-
305
-
306
-
307
-
308
-
309
-
310
-
311
-
312
-
313
-
314
-
315
-
316
-
317
-
318
-
319
-
320
-
321
-
322
-
323
-
324
-
325
-
326
-
327
-
328
-
329
-
330
-
331
-
332
-
333
-
334
-
335
-
336
-
337
-
338
-
339
-
340
-
341
-
342
-
343
-
344
-
345
-
346
-
347
-
348
-
349
-
350
-
351
-
352
-
353
-
354
-
355
-
356
-
357
-
358
-
359
-
360
-
361
-
362
-
363
-
364
-
365
-
366
-
367
-
368
-
369
-
370
-
371
-
372
-
373
-
374
-
375
-
376
-
377
-
378
-
379
-
380
-
381
-
382
-
383
-
384
-
385
-
386
-
387
-
388
-
389
-
390
-
391
-
392
-
393
-
394
-
395
-
396
-
397
-
398
-
399
-
400
-
401
-
402
-
403
-
404
-
405
-
406
-
407
-
408
-
409
-
410
-
411
-
412
-
413
-
414
-
415
-
416
-
417
-
418
-
419
-
420
-
421
-
422
-
423
-
424
 |
 |

HSBC HOLDINGS PLC
Financial Review (continued)
84
Canada has indicated that further increases may be
required.
Mexico’s GDP growth was 3.0 per cent
compared with 4.2 per cent in 2004, in line with
lower external demand from the US. The fiscal
accounts for the year showed a reduced deficit of
0.9 per cent, mostly from windfall earnings from
high oil prices. As in 2004, high oil receipts and
increasing levels of workers’ remittances helped
minimise the current account deficit at an estimated
less than 1 per cent of GDP. The biggest
achievement was the reduction in headline inflation
from 5.2 per cent at the end of 2004 to 3.3 per cent
in December 2005, with core inflation finishing the
year at 3.1 per cent. HSBC views macroeconomic
stability as encouragingly robust ahead of what looks
likely to be a keenly contested presidential election
in mid-2006.
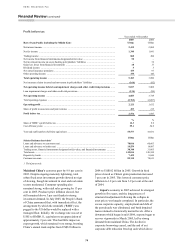
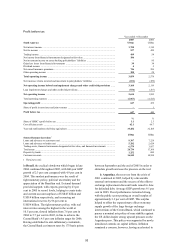
HSBC’s operations in North America reported a
pre-tax profit of US$6,872 million, compared with
US$6,070 million in 2004, representing an increase
of 13 per cent. On an underlying basis, pre-tax
profits grew by 12 per cent and represented around
33 per cent of HSBC’s equivalent total profit. In the
US, the benefits from strong deposit growth in
Personal Financial Services were partly negated by
narrowing spreads on lending in a rising interest rate
environment. In Commercial Banking, growth in
pre-tax profits was largely driven by lending and
deposit balance growth and improved liability
interest margins. In Corporate, Investment Banking
and Markets, growth in revenues was offset by
investment expenditure to build the required
platform and infrastructure for future growth.
The commentary that follows is on an
underlying basis.
Personal Financial Services, including the
consumer finance business, generated a pre-tax
profit of US$4,761 million, 8 per cent higher than in
2004. Under IFRSs, from 1 January 2005, HSBC
changed the accounting treatment for certain debt
issued and related interest rate swaps. This did not
change the underlying economics of the transactions.
The resulting revenues of US$618 million in 2004
are excluded from the following commentary. In
addition, interest income earned on mortgage
balances held on HSBC’s balance sheet pending sale
into the US secondary mortgage market has been
reported under trading income. In 2004 this was
reported in net interest income. This difference in
treatment has also been excluded from the following
commentary.
In the US, profit before tax rose 28 per cent to
US$3,853 million. The rise in profit was largely
driven by widening deposit spreads, strong deposit
and customer loan growth and higher fee income,
partly offset by lower asset spreads due to higher
funding costs. Loan impairment charges fell,
notwithstanding the higher charges due to the
combined impacts of Hurricane Katrina and changes
in bankruptcy legislation. In Mexico, excluding the
transfer of some customers to the Commercial
Banking segment due to alignment with Group
standards, pre-tax profits rose. This was driven by
strong revenue growth from higher deposit balances
and widening spreads, strong loan growth and higher
fee income, partly offset by the non-recurrence in
2005 of loan impairment provision releases in 2004.
Net interest income grew by 5 per cent to
US$12,753 million, largely from increases in the US
and Mexico. In the US, net interest income rose by
3 per cent largely driven by higher deposit balances
and widening deposit spreads. Average loan
balances grew strongly, in particular from prime and
non-prime residential mortgages. With ongoing
strong demand for unsecured lending, the credit
card, private label card and personal non-credit card,
portfolios continued to grow. The benefits of strong
asset growth were largely offset by lower spreads as
interest rates rose.
Additional resources were focused on the core
retail banking business in the US as high priority
was given to growing the deposit base. Investment in
the retail branch network continued, to ensure a
presence in locations with high growth potential.
During the year, 27 new branches were opened, each
tailored to meet the needs of the local market. The
launch of two new deposit products, HSBC’s first
national savings product, ‘Online Savings’, and
‘HSBC Premier Savings’, augmented by a 45 per
cent rise in new personal account openings, led to a
4 per cent growth in average deposit balances to
US$26.7 billion.
Overall, average mortgage balances including
US$3.3 billion held for resale were
US$112.1 billion, representing a 27 per cent
increase. This was due to the significant expansion
of adjustable rate mortgages (‘ARMs’) originated
during 2004 in the US bank and strong growth
within the mortgage services and branch-based
consumer lending businesses. These volume benefits
were largely offset by narrowing spreads as yields
fell due to changes in product mix and higher
funding costs.
Prime mortgages originated in 2005 were
largely sold into the large government sponsored
mortgage associations, reflecting a strategic decision
to focus on loans originated through the retail