HSBC 2005 Annual Report Download - page 128
Download and view the complete annual report
Please find page 128 of the 2005 HSBC annual report below. You can navigate through the pages in the report by either clicking on the pages listed below, or by using the keyword search tool below to find specific information within the annual report.-
 1
1 -
2
-
3
-
4
-
5
-
6
-
7
-
8
-
9
-
10
-
11
-
12
-
13
-
14
-
15
-
16
-
17
-
18
-
19
-
20
-
21
-
22
-
23
-
24
-
25
-
26
-
27
-
28
-
29
-
30
-
31
-
32
-
33
-
34
-
35
-
36
-
37
-
38
-
39
-
40
-
41
-
42
-
43
-
44
-
45
-
46
-
47
-
48
-
49
-
50
-
51
-
52
-
53
-
54
-
55
-
56
-
57
-
58
-
59
-
60
-
61
-
62
-
63
-
64
-
65
-
66
-
67
-
68
-
69
-
70
-
71
-
72
-
73
-
74
-
75
-
76
-
77
-
78
-
79
-
80
-
81
-
82
-
83
-
84
-
85
-
86
-
87
-
88
-
89
-
90
-
91
-
92
-
93
-
94
-
95
-
96
-
97
-
98
-
99
-
100
-
101
-
102
-
103
-
104
-
105
-
106
-
107
-
108
-
109
-
110
-
111
-
112
-
113
-
114
-
115
-
116
-
117
-
 118
118 -
 119
119 -
 120
120 -
 121
121 -
 122
122 -
 123
123 -
 124
124 -
 125
125 -
 126
126 -
 127
127 -
 128
128 -
 129
129 -
 130
130 -
 131
131 -
 132
132 -
 133
133 -
 134
134 -
 135
135 -
 136
136 -
 137
137 -
 138
138 -
139
-
140
-
141
-
142
-
143
-
144
-
145
-
146
-
147
-
148
-
149
-
150
-
151
-
152
-
153
-
154
-
155
-
156
-
157
-
158
-
159
-
160
-
161
-
162
-
163
-
164
-
165
-
166
-
167
-
168
-
169
-
170
-
171
-
172
-
173
-
174
-
175
-
176
-
177
-
178
-
179
-
180
-
181
-
182
-
183
-
184
-
185
-
186
-
187
-
188
-
189
-
190
-
191
-
192
-
193
-
194
-
195
-
196
-
197
-
198
-
199
-
200
-
201
-
202
-
203
-
204
-
205
-
206
-
207
-
208
-
209
-
210
-
211
-
212
-
213
-
214
-
215
-
216
-
217
-
218
-
219
-
220
-
221
-
222
-
223
-
224
-
225
-
226
-
227
-
228
-
229
-
230
-
231
-
232
-
233
-
234
-
235
-
236
-
237
-
238
-
239
-
240
-
241
-
242
-
243
-
244
-
245
-
246
-
247
-
248
-
249
-
250
-
251
-
252
-
253
-
254
-
255
-
256
-
257
-
258
-
259
-
260
-
261
-
262
-
263
-
264
-
265
-
266
-
267
-
268
-
269
-
270
-
271
-
272
-
273
-
274
-
275
-
276
-
277
-
278
-
279
-
280
-
281
-
282
-
283
-
284
-
285
-
286
-
287
-
288
-
289
-
290
-
291
-
292
-
293
-
294
-
295
-
296
-
297
-
298
-
299
-
300
-
301
-
302
-
303
-
304
-
305
-
306
-
307
-
308
-
309
-
310
-
311
-
312
-
313
-
314
-
315
-
316
-
317
-
318
-
319
-
320
-
321
-
322
-
323
-
324
-
325
-
326
-
327
-
328
-
329
-
330
-
331
-
332
-
333
-
334
-
335
-
336
-
337
-
338
-
339
-
340
-
341
-
342
-
343
-
344
-
345
-
346
-
347
-
348
-
349
-
350
-
351
-
352
-
353
-
354
-
355
-
356
-
357
-
358
-
359
-
360
-
361
-
362
-
363
-
364
-
365
-
366
-
367
-
368
-
369
-
370
-
371
-
372
-
373
-
374
-
375
-
376
-
377
-
378
-
379
-
380
-
381
-
382
-
383
-
384
-
385
-
386
-
387
-
388
-
389
-
390
-
391
-
392
-
393
-
394
-
395
-
396
-
397
-
398
-
399
-
400
-
401
-
402
-
403
-
404
-
405
-
406
-
407
-
408
-
409
-
410
-
411
-
412
-
413
-
414
-
415
-
416
-
417
-
418
-
419
-
420
-
421
-
422
-
423
-
424
 |
 |

HSBC HOLDINGS PLC
Financial Review (continued)
126
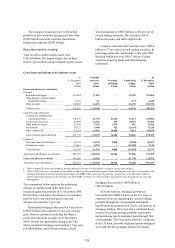
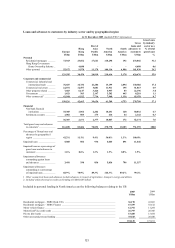
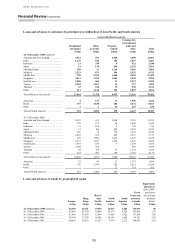
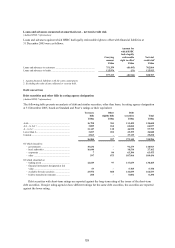
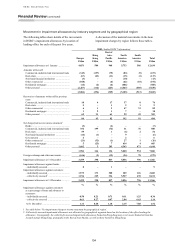
Loans and advances to customers by principal area within Rest of Asia-Pacific and South America
Loans and advances (gross)
Residential
mortgages
US$m
Other
personal
US$m
Property-
related
US$m
Commercial,
international
trade and
other
US$m
Total
US$m
At 31 December 2005 (audited)
Australia and New Zealand ................... 5,912 694 2,588 3,698 12,892
India ...................................................... 1,139 545 104 1,819 3,607
Indonesia ............................................... 13 338 8 921 1,280
Japan ..................................................... 14 139 696 2,352 3,201
Mainland China ..................................... 358 11 1,210 3,426 5,005
Malaysia ................................................ 2,223 871 496 2,925 6,515
Middle East ........................................... 258 2,320 1,448 9,403 13,429
Singapore ............................................... 2,811 3,395 1,441 2,249 9,896
South Korea ........................................... 2,585 460 31 2,219 5,295
Taiwan ................................................... 2,094 1,057 14 727 3,892
Thailand ................................................ 23 220 75 958 1,276
Other ..................................................... 211 1,128 396 2,829 4,564
Total of Rest of Asia-Pacific ................. 17,641 11,178 8,507 33,526 70,852
Argentina ............................................... 4 147 31 1,000 1,182
Brazil ..................................................... 187 4,838 206 3,432 8,663
Other ..................................................... 1 1 41 215 258
Total of South America ......................... 192 4,986 278 4,647 10,103
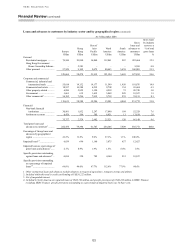
At 31 December 2004
Australia and New Zealand ..................... 5,935 635 2,580 3,761 12,911
India ........................................................ 778 371 56 1,440 2,645
Indonesia ................................................. 12 166 9 769 956
Japan ....................................................... 12 106 689 3,532 4,339
Mainland China ....................................... 256 10 794 3,329 4,389
Malaysia .................................................. 2,029 670 407 2,611 5,717
Middle East ............................................. 129 1,982 1,414 6,327 9,852
Singapore ................................................. 2,137 3,027 1,262 2,258 8,684
South Korea ............................................. 1,834 189 6 1,559 3,588
Taiwan ..................................................... 1,509 762 – 805 3,076
Thailand .................................................. 28 178 75 1,134 1,415
Other ....................................................... 201 983 290 2,701 4,175
Total of Rest of Asia-Pacific ................... 14,860 9,079 7,582 30,226 61,747
Argentina ................................................. 37 69 21 1,372 1,499
Brazil ....................................................... 170 3,369 158 2,411 6,108
Other ....................................................... – – 27 175 202
Total of South America ........................... 207 3,438 206 3,958 7,809
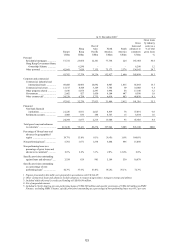
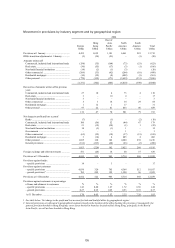
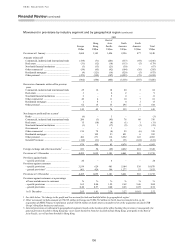
Loans and advances to banks by geographical region
Europe
Hong
Kong
Rest of
Asia-
Pacific
North
America
South
America
Gross
loans and
advances
to banks
Impairment
allowances
(2001-2004:
provisions
for bad and
doubtful
debts)
US$m US$m US$m US$m US$m US$m US$m
At 31 December 2005 (audited) ............. 44,369 42,751 19,559 14,013 5,282 125,974 (9)
At 31 December 2004 .............................. 56,063 45,710 14,890 24,179 2,624 143,466 (17)
At 31 December 2003 .............................. 51,806 38,639 12,948 11,885 1,922 117,200 (24)
At 31 December 2002 .............................. 39,398 33,359 10,708 10,391 1,665 95,521 (23)
At 31 December 2001 .............................. 40,665 42,516 11,253 7,979 2,252 104,665 (22)