HSBC 2005 Annual Report Download - page 69
Download and view the complete annual report
Please find page 69 of the 2005 HSBC annual report below. You can navigate through the pages in the report by either clicking on the pages listed below, or by using the keyword search tool below to find specific information within the annual report.-
 1
1 -
2
-
3
-
4
-
5
-
6
-
7
-
8
-
9
-
10
-
11
-
12
-
13
-
14
-
15
-
16
-
17
-
18
-
19
-
20
-
21
-
22
-
23
-
24
-
25
-
26
-
27
-
28
-
29
-
30
-
31
-
32
-
33
-
34
-
35
-
36
-
37
-
38
-
39
-
40
-
41
-
42
-
43
-
44
-
45
-
46
-
47
-
48
-
49
-
50
-
51
-
52
-
53
-
54
-
55
-
56
-
57
-
58
-
 59
59 -
 60
60 -
 61
61 -
 62
62 -
 63
63 -
 64
64 -
 65
65 -
 66
66 -
 67
67 -
 68
68 -
 69
69 -
 70
70 -
 71
71 -
 72
72 -
 73
73 -
 74
74 -
 75
75 -
 76
76 -
 77
77 -
 78
78 -
 79
79 -
80
-
81
-
82
-
83
-
84
-
85
-
86
-
87
-
88
-
89
-
90
-
91
-
92
-
93
-
94
-
95
-
96
-
97
-
98
-
99
-
100
-
101
-
102
-
103
-
104
-
105
-
106
-
107
-
108
-
109
-
110
-
111
-
112
-
113
-
114
-
115
-
116
-
117
-
118
-
119
-
120
-
121
-
122
-
123
-
124
-
125
-
126
-
127
-
128
-
129
-
130
-
131
-
132
-
133
-
134
-
135
-
136
-
137
-
138
-
139
-
140
-
141
-
142
-
143
-
144
-
145
-
146
-
147
-
148
-
149
-
150
-
151
-
152
-
153
-
154
-
155
-
156
-
157
-
158
-
159
-
160
-
161
-
162
-
163
-
164
-
165
-
166
-
167
-
168
-
169
-
170
-
171
-
172
-
173
-
174
-
175
-
176
-
177
-
178
-
179
-
180
-
181
-
182
-
183
-
184
-
185
-
186
-
187
-
188
-
189
-
190
-
191
-
192
-
193
-
194
-
195
-
196
-
197
-
198
-
199
-
200
-
201
-
202
-
203
-
204
-
205
-
206
-
207
-
208
-
209
-
210
-
211
-
212
-
213
-
214
-
215
-
216
-
217
-
218
-
219
-
220
-
221
-
222
-
223
-
224
-
225
-
226
-
227
-
228
-
229
-
230
-
231
-
232
-
233
-
234
-
235
-
236
-
237
-
238
-
239
-
240
-
241
-
242
-
243
-
244
-
245
-
246
-
247
-
248
-
249
-
250
-
251
-
252
-
253
-
254
-
255
-
256
-
257
-
258
-
259
-
260
-
261
-
262
-
263
-
264
-
265
-
266
-
267
-
268
-
269
-
270
-
271
-
272
-
273
-
274
-
275
-
276
-
277
-
278
-
279
-
280
-
281
-
282
-
283
-
284
-
285
-
286
-
287
-
288
-
289
-
290
-
291
-
292
-
293
-
294
-
295
-
296
-
297
-
298
-
299
-
300
-
301
-
302
-
303
-
304
-
305
-
306
-
307
-
308
-
309
-
310
-
311
-
312
-
313
-
314
-
315
-
316
-
317
-
318
-
319
-
320
-
321
-
322
-
323
-
324
-
325
-
326
-
327
-
328
-
329
-
330
-
331
-
332
-
333
-
334
-
335
-
336
-
337
-
338
-
339
-
340
-
341
-
342
-
343
-
344
-
345
-
346
-
347
-
348
-
349
-
350
-
351
-
352
-
353
-
354
-
355
-
356
-
357
-
358
-
359
-
360
-
361
-
362
-
363
-
364
-
365
-
366
-
367
-
368
-
369
-
370
-
371
-
372
-
373
-
374
-
375
-
376
-
377
-
378
-
379
-
380
-
381
-
382
-
383
-
384
-
385
-
386
-
387
-
388
-
389
-
390
-
391
-
392
-
393
-
394
-
395
-
396
-
397
-
398
-
399
-
400
-
401
-
402
-
403
-
404
-
405
-
406
-
407
-
408
-
409
-
410
-
411
-
412
-
413
-
414
-
415
-
416
-
417
-
418
-
419
-
420
-
421
-
422
-
423
-
424
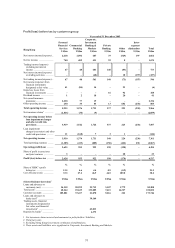
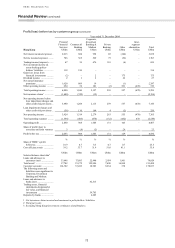
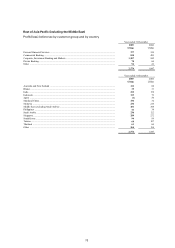
 |
 |
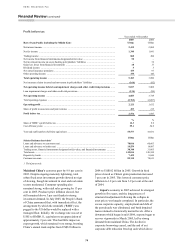
67
Hong Kong’s economy grew by 7.3 per cent in
2005, down from the growth of 8.6 per cent achieved
in 2004. Robust domestic demand provided strong
support, particularly in the second half of the year,
and external trade maintained its rapid rate of
growth. Despite a substantial rise of more than 3 per
cent in local interest rates in 2005, domestic demand
continued to expand, reflecting a sustained
improvement in business and consumer confidence.
Increased consumer spending, spurred by greater job
security as unemployment fell, and improving
household incomes, became a key driver of growth
in the latter part of the year. The rise in domestic
spending more than offset the slower growth in
tourists’ spending which occurred in 2005,
particularly among mainland visitors, and consumer
optimism remained unaffected by a cooling in the
property market induced by the higher interest rate
environment. Hong Kong’s strong export
performance also propelled growth, benefiting from
sustained external demand and foreign importers
building up inventories as trade talks continued on
textile quotas between mainland China and its major
trading partners. Domestic exports also picked up,
reflecting increased local production. In 2005,
inflation rose to 1.1 per cent, mainly driven by
increased demand for property rentals.
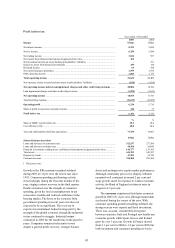
HSBC’s operations in Hong Kong reported a
pre-tax profit of US$4,517 million, compared with
US$4,830 million in 2004. IFRSs changes to the
treatment of preference share dividends led to a
US$387 million decrease in pre-tax profits.
Excluding this, profits increased by 2 per cent.
Subdued profit growth was largely attributable to a
turnaround in loan impairment charges, as 2004
benefited from non-recurring releases from general
provisions, and a fall in balance sheet management
revenues. Pre-tax profits in Hong Kong represented
around 22 per cent of HSBC’s total profit at this
level. In Corporate, Investment Banking and
Markets, balance sheet management revenues were
negatively affected by the influence of short-term
interest rate rises and a flattening yield curve.
Expense growth in Corporate, Investment Banking
and Markets reflected the first full-year effect of the
investment made to support business expansion. Pre-
tax profits of Personal Financial Services and
Commercial Banking grew by 27 per cent and
6 per cent respectively, benefiting from a sharp rise
in deposit spreads as short-term interest rates
increased in a benign credit environment.
The commentary that follows is on an
underlying basis.
Personal Financial Services reported a pre-tax
profit of US$2,628 million, 27 per cent higher than
in 2004. This was largely due to widening deposit
spreads, deposit growth and improved credit quality.
During the year, HSBC placed considerable
emphasis on maintaining its leadership position and
meeting customer needs in both the credit cards and
insurance businesses. Market share of both spend
and balances grew in respect of credit cards along
with strong insurance revenue growth.
Net interest income grew by 30 per cent to
US$2,618 million. During 2005, interest rates in
Hong Kong rose significantly, reflecting rising US
dollar interest rates. In addition, adjustments to the
Hong Kong: US dollar linked exchange rate system
reduced the likelihood of an upward realignment of
the Hong Kong dollar, prompting a reversal of much
of the inward flows from investors that had
depressed local market rates in 2004. Consequently,
deposit spreads widened to more normal levels after
the exceptionally low spreads experienced in 2004.
Interest rate rises also helped stimulate growth in
average deposit balances as investor sentiment
moved away from long-term equity-related
investments into shorter-term liquid deposits.
Despite the competitive deposit market, average
balances grew by US$2.9 billion, or 3 per cent.
The mortgage market remained highly
competitive during 2005. During the first half of the
year, HSBC did not aggressively compete on price
but maintained a selective approach to mortgage
approvals, mainly by offering competitive rates to
the existing customer base. Yields gradually
improved during the year, as HSBC repriced
upwards following a series of interest rates increases.
Spreads declined compared with 2004, as
improvements in yields were more than offset by
higher funding costs following rising interest rates.
Average mortgage balances, excluding the reduction
in balances under the suspended Hong Kong
Government Home Ownership Scheme (‘GHOS’)
grew by 1 per cent, despite the highly competitive
environment.
Average credit card balances grew by 10 per
cent, and HSBC’s market share of card balances also
increased by 550 basis points led by targeted
promotional campaigns and rewards programmes.
These volume benefits were more than offset by
lower spreads, mainly due to higher funding costs as
interest rates rose.
Net fees fell by 6 per cent to US$740 million,
driven mainly by lower sales of unit trusts and
capital guaranteed funds, partly offset by higher
sales of structured deposit products and open-ended
funds. A 34 per cent fall in unit trust fee income was
driven by a change in market sentiment during 2005.