HSBC 2005 Annual Report Download - page 399
Download and view the complete annual report
Please find page 399 of the 2005 HSBC annual report below. You can navigate through the pages in the report by either clicking on the pages listed below, or by using the keyword search tool below to find specific information within the annual report.-
 1
1 -
2
-
3
-
4
-
5
-
6
-
7
-
8
-
9
-
10
-
11
-
12
-
13
-
14
-
15
-
16
-
17
-
18
-
19
-
20
-
21
-
22
-
23
-
24
-
25
-
26
-
27
-
28
-
29
-
30
-
31
-
32
-
33
-
34
-
35
-
36
-
37
-
38
-
39
-
40
-
41
-
42
-
43
-
44
-
45
-
46
-
47
-
48
-
49
-
50
-
51
-
52
-
53
-
54
-
55
-
56
-
57
-
58
-
59
-
60
-
61
-
62
-
63
-
64
-
65
-
66
-
67
-
68
-
69
-
70
-
71
-
72
-
73
-
74
-
75
-
76
-
77
-
78
-
79
-
80
-
81
-
82
-
83
-
84
-
85
-
86
-
87
-
88
-
89
-
90
-
91
-
92
-
93
-
94
-
95
-
96
-
97
-
98
-
99
-
100
-
101
-
102
-
103
-
104
-
105
-
106
-
107
-
108
-
109
-
110
-
111
-
112
-
113
-
114
-
115
-
116
-
117
-
118
-
119
-
120
-
121
-
122
-
123
-
124
-
125
-
126
-
127
-
128
-
129
-
130
-
131
-
132
-
133
-
134
-
135
-
136
-
137
-
138
-
139
-
140
-
141
-
142
-
143
-
144
-
145
-
146
-
147
-
148
-
149
-
150
-
151
-
152
-
153
-
154
-
155
-
156
-
157
-
158
-
159
-
160
-
161
-
162
-
163
-
164
-
165
-
166
-
167
-
168
-
169
-
170
-
171
-
172
-
173
-
174
-
175
-
176
-
177
-
178
-
179
-
180
-
181
-
182
-
183
-
184
-
185
-
186
-
187
-
188
-
189
-
190
-
191
-
192
-
193
-
194
-
195
-
196
-
197
-
198
-
199
-
200
-
201
-
202
-
203
-
204
-
205
-
206
-
207
-
208
-
209
-
210
-
211
-
212
-
213
-
214
-
215
-
216
-
217
-
218
-
219
-
220
-
221
-
222
-
223
-
224
-
225
-
226
-
227
-
228
-
229
-
230
-
231
-
232
-
233
-
234
-
235
-
236
-
237
-
238
-
239
-
240
-
241
-
242
-
243
-
244
-
245
-
246
-
247
-
248
-
249
-
250
-
251
-
252
-
253
-
254
-
255
-
256
-
257
-
258
-
259
-
260
-
261
-
262
-
263
-
264
-
265
-
266
-
267
-
268
-
269
-
270
-
271
-
272
-
273
-
274
-
275
-
276
-
277
-
278
-
279
-
280
-
281
-
282
-
283
-
284
-
285
-
286
-
287
-
288
-
289
-
290
-
291
-
292
-
293
-
294
-
295
-
296
-
297
-
298
-
299
-
300
-
301
-
302
-
303
-
304
-
305
-
306
-
307
-
308
-
309
-
310
-
311
-
312
-
313
-
314
-
315
-
316
-
317
-
318
-
319
-
320
-
321
-
322
-
323
-
324
-
325
-
326
-
327
-
328
-
329
-
330
-
331
-
332
-
333
-
334
-
335
-
336
-
337
-
338
-
339
-
340
-
341
-
342
-
343
-
344
-
345
-
346
-
347
-
348
-
349
-
350
-
351
-
352
-
353
-
354
-
355
-
356
-
357
-
358
-
359
-
360
-
361
-
362
-
363
-
364
-
365
-
366
-
367
-
368
-
369
-
370
-
371
-
372
-
373
-
374
-
375
-
376
-
377
-
378
-
379
-
380
-
381
-
382
-
383
-
384
-
385
-
386
-
387
-
388
-
 389
389 -
 390
390 -
 391
391 -
 392
392 -
 393
393 -
 394
394 -
 395
395 -
 396
396 -
 397
397 -
 398
398 -
 399
399 -
 400
400 -
 401
401 -
 402
402 -
 403
403 -
 404
404 -
 405
405 -
 406
406 -
 407
407 -
 408
408 -
 409
409 -
410
-
411
-
412
-
413
-
414
-
415
-
416
-
417
-
418
-
419
-
420
-
421
-
422
-
423
-
424
 |
 |

397
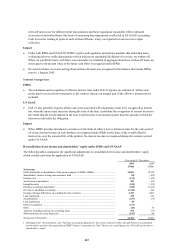
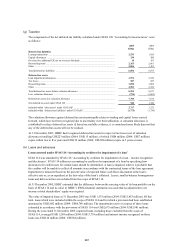
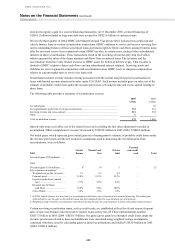
(g) Taxation
The components of the net deferred tax liability calculated under SFAS 109 ‘Accounting for income taxes’, were
as follows:
2005 2004
US$m US$m
Deferred tax liabilities
Leasing transactions .............................................................................................................. 2,533 1,924
Capital allowances ................................................................................................................ 138 280
Provision for additional UK tax on overseas dividends ......................................................... 18 107
Reconciling items .................................................................................................................. 2,163 2,661
Other ..................................................................................................................................... 2,004 1,101
Total deferred tax liabilities .................................................................................................. 6,856 6,073
Deferred tax assets
Loan impairment allowances ................................................................................................. 1,974 2,530
Tax losses .............................................................................................................................. 587 827
Reconciling items .................................................................................................................. 1,050 3,066
Other ..................................................................................................................................... 4,981 2,254
Total deferred tax assets before valuation allowance ............................................................ 8,592 8,677
Less: valuation allowance ..................................................................................................... (794) (1,062)
Deferred tax assets less valuation allowance ......................................................................... 7,798 7,615
Net deferred tax asset under SFAS 109 ................................................................................. 942 1,542
Included within ‘other assets’ under US GAAP .................................................................... 2,717 3,272
Included within ‘deferred tax liabilities’ under US GAAP .................................................... (1,775) (1,730)
The valuation allowance against deferred tax assets principally relates to trading and capital losses carried
forward, which have not been recognised due to uncertainty over their utilisation. A valuation allowance is
established to reduce deferred tax assets if, based on available evidence, it is considered more likely than not that
any of the deferred tax assets will not be realised.
At 31 December 2005, HSBC had recognised deferred tax assets in respect of tax losses (net of valuation
allowances) totalling US$223 million (2004: US$115 million), of which US$4 million (2004: US$7 million)
expire within two to five years and US$219 million (2004: US$108 million) expire in 5 years or more.
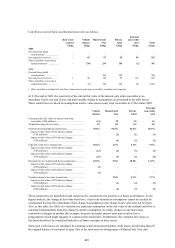
(h) Loans and advances
Loans assessed under SFAS 114 ‘Accounting by creditors for impairment of a loan’
SFAS 114 was amended by SFAS 118 ‘Accounting by creditors for impairment of a loan – income recognition
and disclosures’. SFAS 114 addresses accounting by creditors for impairment of a loan by specifying how
allowances for credit losses for certain loans should be determined. A loan is impaired when it is probable that
the creditor will be unable to collect all amounts in accordance with the contractual terms of the loan agreement.
Impairment is measured based on the present value of expected future cash flows discounted at the loan’s
effective rate or, as an expedient, at the fair value of the loan’s collateral. Leases, smaller-balance homogeneous
loans and debt securities are excluded from the scope of SFAS 114.
At 31 December 2005, HSBC estimated that the difference between the carrying value of its loan portfolio on the
basis of SFAS 114 and its value in HSBC’s IFRSs financial statements was such that no adjustment to net
income or total shareholders’ equity was required.
The value of impaired loans at 31 December 2005 was US$11,535 million (2004: US$12,453 million). Of this
total, loans which were included within the scope of SFAS 114 and for which a provision had been established
amounted to US$5,082 million (2004: US$6,780 million). The impairment reserve in respect of these loans
estimated in accordance with the provisions of SFAS 114 was US$2,675 million (2004: US$3,981 million).
During the year ended 31 December 2005, impaired loans, including those excluded from the scope of
SFAS 114, averaged US$11,289 million (2004: US$13,739 million) and interest income recognised on these
loans was US$120 million (2004: US$184 million).