HSBC 2005 Annual Report Download - page 35
Download and view the complete annual report
Please find page 35 of the 2005 HSBC annual report below. You can navigate through the pages in the report by either clicking on the pages listed below, or by using the keyword search tool below to find specific information within the annual report.-
 1
1 -
2
-
3
-
4
-
5
-
6
-
7
-
8
-
9
-
10
-
11
-
12
-
13
-
14
-
15
-
16
-
17
-
18
-
19
-
20
-
21
-
22
-
23
-
24
-
 25
25 -
 26
26 -
 27
27 -
 28
28 -
 29
29 -
 30
30 -
 31
31 -
 32
32 -
 33
33 -
 34
34 -
 35
35 -
 36
36 -
 37
37 -
 38
38 -
 39
39 -
 40
40 -
 41
41 -
 42
42 -
 43
43 -
 44
44 -
 45
45 -
46
-
47
-
48
-
49
-
50
-
51
-
52
-
53
-
54
-
55
-
56
-
57
-
58
-
59
-
60
-
61
-
62
-
63
-
64
-
65
-
66
-
67
-
68
-
69
-
70
-
71
-
72
-
73
-
74
-
75
-
76
-
77
-
78
-
79
-
80
-
81
-
82
-
83
-
84
-
85
-
86
-
87
-
88
-
89
-
90
-
91
-
92
-
93
-
94
-
95
-
96
-
97
-
98
-
99
-
100
-
101
-
102
-
103
-
104
-
105
-
106
-
107
-
108
-
109
-
110
-
111
-
112
-
113
-
114
-
115
-
116
-
117
-
118
-
119
-
120
-
121
-
122
-
123
-
124
-
125
-
126
-
127
-
128
-
129
-
130
-
131
-
132
-
133
-
134
-
135
-
136
-
137
-
138
-
139
-
140
-
141
-
142
-
143
-
144
-
145
-
146
-
147
-
148
-
149
-
150
-
151
-
152
-
153
-
154
-
155
-
156
-
157
-
158
-
159
-
160
-
161
-
162
-
163
-
164
-
165
-
166
-
167
-
168
-
169
-
170
-
171
-
172
-
173
-
174
-
175
-
176
-
177
-
178
-
179
-
180
-
181
-
182
-
183
-
184
-
185
-
186
-
187
-
188
-
189
-
190
-
191
-
192
-
193
-
194
-
195
-
196
-
197
-
198
-
199
-
200
-
201
-
202
-
203
-
204
-
205
-
206
-
207
-
208
-
209
-
210
-
211
-
212
-
213
-
214
-
215
-
216
-
217
-
218
-
219
-
220
-
221
-
222
-
223
-
224
-
225
-
226
-
227
-
228
-
229
-
230
-
231
-
232
-
233
-
234
-
235
-
236
-
237
-
238
-
239
-
240
-
241
-
242
-
243
-
244
-
245
-
246
-
247
-
248
-
249
-
250
-
251
-
252
-
253
-
254
-
255
-
256
-
257
-
258
-
259
-
260
-
261
-
262
-
263
-
264
-
265
-
266
-
267
-
268
-
269
-
270
-
271
-
272
-
273
-
274
-
275
-
276
-
277
-
278
-
279
-
280
-
281
-
282
-
283
-
284
-
285
-
286
-
287
-
288
-
289
-
290
-
291
-
292
-
293
-
294
-
295
-
296
-
297
-
298
-
299
-
300
-
301
-
302
-
303
-
304
-
305
-
306
-
307
-
308
-
309
-
310
-
311
-
312
-
313
-
314
-
315
-
316
-
317
-
318
-
319
-
320
-
321
-
322
-
323
-
324
-
325
-
326
-
327
-
328
-
329
-
330
-
331
-
332
-
333
-
334
-
335
-
336
-
337
-
338
-
339
-
340
-
341
-
342
-
343
-
344
-
345
-
346
-
347
-
348
-
349
-
350
-
351
-
352
-
353
-
354
-
355
-
356
-
357
-
358
-
359
-
360
-
361
-
362
-
363
-
364
-
365
-
366
-
367
-
368
-
369
-
370
-
371
-
372
-
373
-
374
-
375
-
376
-
377
-
378
-
379
-
380
-
381
-
382
-
383
-
384
-
385
-
386
-
387
-
388
-
389
-
390
-
391
-
392
-
393
-
394
-
395
-
396
-
397
-
398
-
399
-
400
-
401
-
402
-
403
-
404
-
405
-
406
-
407
-
408
-
409
-
410
-
411
-
412
-
413
-
414
-
415
-
416
-
417
-
418
-
419
-
420
-
421
-
422
-
423
-
424
 |
 |

33
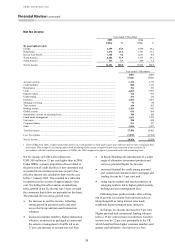
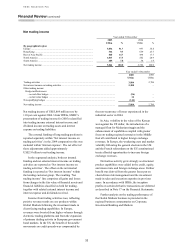
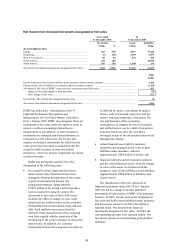
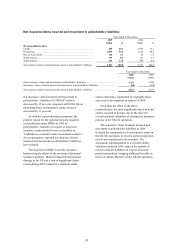
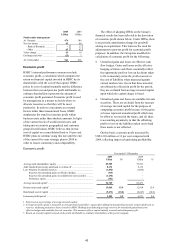
Net income from financial instruments designated at fair value
Year ended
31 December 2005
At
31 December 2005
Net income Assets Liabilities
US$m % US$m US$m
By geographical region
Europe .............................................................................................. 362 35.0 9,077 27,442
Hong Kong ....................................................................................... (6) (0.6) 3,909 3,999
Rest of Asia-Pacific .......................................................................... 58 5.6 872 300
North America .................................................................................. 434 42.0 – 29,934
South America .................................................................................. 186 18.0 1,188 154
Net income from financial instruments designated at fair value ....... 1,034 100.0 15,046 61,829
2005
US$m
Income from assets held to meet liabilities under insurance and investment contracts .................................................... 1,760
Change in fair value of liabilities to customers under investment contracts .................................................................... (1,126)
Movement in fair value of HSBC’s long-term debt issued and related derivatives .......................................................... 403
– change in own credit spread on long-term debt ........................................................................................................ (70)
– other changes in fair value ........................................................................................................................................ 473
Income from other instruments designated at fair value .................................................................................................. (3)
Net income from financial instruments designated at fair value ...................................................................................... 1,034
HSBC has utilised the ‘Amendment to IAS 39
Financial Instruments: Recognition and
Measurement: the Fair Value Option’ with effect
from 1 January 2005. HSBC may designate financial
instruments at fair value under the option in order to
remove or reduce accounting mismatches in
measurement or presentation, or where financial
instruments are managed and their performance is
evaluated on a fair value basis. All income and
expense on financial instruments for which the fair
value option has been taken is included in this line
except for debt securities in issue and related
derivatives, where the interest components are shown
in interest income.
HSBC has principally used the fair value
designation in the following cases:
• for certain fixed rate long-term debt issues
whose interest rate characteristic has been
changed to floating through interest rate swaps
as part of a documented interest rate
management strategy. Approximately
US$51 billion of the Group’s debt issues have
been accounted for using the option. The
movement in fair value of these debt issues
includes the effect of changes in own credit
spread and any ineffectiveness in the economic
relationship between the related swaps and own
debt. Such ineffectiveness arises from the
different credit characteristics of the swap and
own debt coupled with the sensitivity of the
floating leg of the swap to changes in short-term
interest rates. In addition, the economic
relationship between the swap and own debt can
be affected by relative movements in market
factors, such as bond and swap rates, and the
relative bond and swap rates at inception. The
size and direction of the accounting
consequences of changes in own credit spread
and ineffectiveness can be volatile from period
to period, but do not alter the cash flows
envisaged as part of the documented interest rate
management strategy;
• certain financial assets held by insurance
operations and managed at fair value to meet
liabilities under insurance contracts
(approximately US$4 billion of assets); and
• financial liabilities under investment contracts
and the related financial assets, when the change
in value of the assets is correlated with the
change in value of the liabilities to policyholders
(approximately US$8 billion of liabilities and
related assets).
The introduction of the new categories of
financial instruments under IAS 39 on 1 January
2005 has led to a change in income statement
presentation for the results of HSBC’s life insurance
business. In 2005, income from assets designated at
fair value and held to meet liabilities under insurance
and investment contracts of US$1,760 million is
reported under ‘Net income from financial
instruments designated at fair value’. In 2004, the
corresponding amounts were reported within ‘Net
investment income on assets backing policyholders’
liabilities’.