HSBC 2005 Annual Report Download - page 316
Download and view the complete annual report
Please find page 316 of the 2005 HSBC annual report below. You can navigate through the pages in the report by either clicking on the pages listed below, or by using the keyword search tool below to find specific information within the annual report.-
 1
1 -
2
-
3
-
4
-
5
-
6
-
7
-
8
-
9
-
10
-
11
-
12
-
13
-
14
-
15
-
16
-
17
-
18
-
19
-
20
-
21
-
22
-
23
-
24
-
25
-
26
-
27
-
28
-
29
-
30
-
31
-
32
-
33
-
34
-
35
-
36
-
37
-
38
-
39
-
40
-
41
-
42
-
43
-
44
-
45
-
46
-
47
-
48
-
49
-
50
-
51
-
52
-
53
-
54
-
55
-
56
-
57
-
58
-
59
-
60
-
61
-
62
-
63
-
64
-
65
-
66
-
67
-
68
-
69
-
70
-
71
-
72
-
73
-
74
-
75
-
76
-
77
-
78
-
79
-
80
-
81
-
82
-
83
-
84
-
85
-
86
-
87
-
88
-
89
-
90
-
91
-
92
-
93
-
94
-
95
-
96
-
97
-
98
-
99
-
100
-
101
-
102
-
103
-
104
-
105
-
106
-
107
-
108
-
109
-
110
-
111
-
112
-
113
-
114
-
115
-
116
-
117
-
118
-
119
-
120
-
121
-
122
-
123
-
124
-
125
-
126
-
127
-
128
-
129
-
130
-
131
-
132
-
133
-
134
-
135
-
136
-
137
-
138
-
139
-
140
-
141
-
142
-
143
-
144
-
145
-
146
-
147
-
148
-
149
-
150
-
151
-
152
-
153
-
154
-
155
-
156
-
157
-
158
-
159
-
160
-
161
-
162
-
163
-
164
-
165
-
166
-
167
-
168
-
169
-
170
-
171
-
172
-
173
-
174
-
175
-
176
-
177
-
178
-
179
-
180
-
181
-
182
-
183
-
184
-
185
-
186
-
187
-
188
-
189
-
190
-
191
-
192
-
193
-
194
-
195
-
196
-
197
-
198
-
199
-
200
-
201
-
202
-
203
-
204
-
205
-
206
-
207
-
208
-
209
-
210
-
211
-
212
-
213
-
214
-
215
-
216
-
217
-
218
-
219
-
220
-
221
-
222
-
223
-
224
-
225
-
226
-
227
-
228
-
229
-
230
-
231
-
232
-
233
-
234
-
235
-
236
-
237
-
238
-
239
-
240
-
241
-
242
-
243
-
244
-
245
-
246
-
247
-
248
-
249
-
250
-
251
-
252
-
253
-
254
-
255
-
256
-
257
-
258
-
259
-
260
-
261
-
262
-
263
-
264
-
265
-
266
-
267
-
268
-
269
-
270
-
271
-
272
-
273
-
274
-
275
-
276
-
277
-
278
-
279
-
280
-
281
-
282
-
283
-
284
-
285
-
286
-
287
-
288
-
289
-
290
-
291
-
292
-
293
-
294
-
295
-
296
-
297
-
298
-
299
-
300
-
301
-
302
-
303
-
304
-
305
-
 306
306 -
 307
307 -
 308
308 -
 309
309 -
 310
310 -
 311
311 -
 312
312 -
 313
313 -
 314
314 -
 315
315 -
 316
316 -
 317
317 -
 318
318 -
 319
319 -
 320
320 -
 321
321 -
 322
322 -
 323
323 -
 324
324 -
 325
325 -
 326
326 -
327
-
328
-
329
-
330
-
331
-
332
-
333
-
334
-
335
-
336
-
337
-
338
-
339
-
340
-
341
-
342
-
343
-
344
-
345
-
346
-
347
-
348
-
349
-
350
-
351
-
352
-
353
-
354
-
355
-
356
-
357
-
358
-
359
-
360
-
361
-
362
-
363
-
364
-
365
-
366
-
367
-
368
-
369
-
370
-
371
-
372
-
373
-
374
-
375
-
376
-
377
-
378
-
379
-
380
-
381
-
382
-
383
-
384
-
385
-
386
-
387
-
388
-
389
-
390
-
391
-
392
-
393
-
394
-
395
-
396
-
397
-
398
-
399
-
400
-
401
-
402
-
403
-
404
-
405
-
406
-
407
-
408
-
409
-
410
-
411
-
412
-
413
-
414
-
415
-
416
-
417
-
418
-
419
-
420
-
421
-
422
-
423
-
424
 |
 |

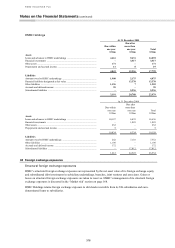
HSBC HOLDINGS PLC
Notes on the Financial Statements (continued)
314
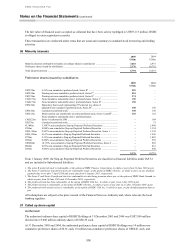
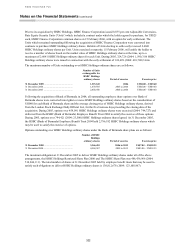
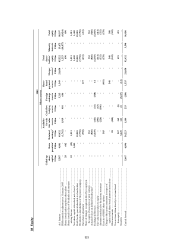
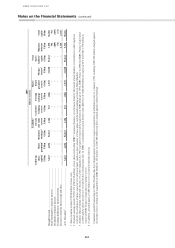
Performing loans are grouped, as far as possible, into homogeneous pools segregated by maturity and the coupon
rates of the loans within each pool. In general, cash flows are discounted using current market rates for
instruments with similar maturity, repricing and credit risk characteristics. For fixed rate loans, assumptions are
made on the expected prepayment rates appropriate to the type of loan.
Conforming residential mortgages in the US are treated differently when there is an established market value for
asset-backed securities. In such cases, fair value is estimated by reference to quoted market prices for loans with
similar characteristics and maturities.
For impaired uncollateralised commercial loans, fair value is estimated by discounting the future cash flows over
the time period they are expected to be recovered. For impaired commercial loans where collateral exists, fair
value is the lower of the carrying values of the loans net of impairment allowances, and the fair value of the
collateral, discounted as appropriate.
(ii) Financial investments
In 2004, financial investments include debt securities and equity shares intended to be held on a continuing
basis. Such financial investments were included in the balance sheet at cost less provision for any permanent
diminution in value.
From 1 January 2005, on implementation of IAS39, the only financial investments not measured at fair value in
the balance sheet are held-to-maturity debt securities. Held-to-maturity debt securities are initially recorded at
fair value plus any directly attributable transaction costs, and are subsequently measured at amortised cost using
the effective interest rate method, less any impairment losses.
The fair values of listed financial investments are determined using bid market prices. The fair values of unlisted
financial investments are determined using valuation techniques that take into consideration future earnings
streams and valuations of equivalent quoted securities.
(iii) Deposits by banks and customer accounts
Deposits by banks and customer accounts are grouped by residual maturity. Fair values are estimated using
discounted cash flows, applying either market rates, where applicable, or current rates offered for deposits of
similar remaining maturities.
(iv) Debt securities in issue and subordinated liabilities
Fair values are determined using quoted market prices at the balance sheet date where applicable, or by reference
to quoted market prices for similar instruments.
The fair values presented in the table above are stated at a specific date and may be significantly different from the
amounts which will actually be paid or received on the maturity or settlement dates of the instruments. In many
cases, it would not be possible to realise immediately the estimated fair values. Accordingly these fair values do not
represent the value of these financial instruments to HSBC as a going concern.
The fair values of intangible assets, such as values placed on portfolios of core deposits, credit card relationships and
customer goodwill, are not included above, because they are not financial instruments.
As other financial institutions use different valuation methodologies and assumptions in determining fair values,
comparisons of fair values between financial institutions may not be meaningful and users are advised to exercise
caution when using this data.
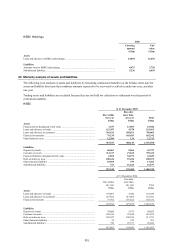
In addition, the following table lists those financial instruments where the carrying amount is a reasonable
approximation of fair value, for example, because they are either short term in nature or reprice to current market
rates frequently:
Assets Liabilities
Cash and balances at central banks Hong Kong Government currency notes in circulation
(representative of Hong Kong banknotes issued)
Items in the course of collection Items in the course of transmission
Hong Kong Government certificates of indebtedness
(representative of Hong Kong banknotes issued)
Endorsements and acceptances
Endorsements and acceptances Short-term payables within ‘Other Liabilities’
Short-term receivables within ‘Other Assets’