HSBC 2005 Annual Report Download - page 397
Download and view the complete annual report
Please find page 397 of the 2005 HSBC annual report below. You can navigate through the pages in the report by either clicking on the pages listed below, or by using the keyword search tool below to find specific information within the annual report.-
 1
1 -
2
-
3
-
4
-
5
-
6
-
7
-
8
-
9
-
10
-
11
-
12
-
13
-
14
-
15
-
16
-
17
-
18
-
19
-
20
-
21
-
22
-
23
-
24
-
25
-
26
-
27
-
28
-
29
-
30
-
31
-
32
-
33
-
34
-
35
-
36
-
37
-
38
-
39
-
40
-
41
-
42
-
43
-
44
-
45
-
46
-
47
-
48
-
49
-
50
-
51
-
52
-
53
-
54
-
55
-
56
-
57
-
58
-
59
-
60
-
61
-
62
-
63
-
64
-
65
-
66
-
67
-
68
-
69
-
70
-
71
-
72
-
73
-
74
-
75
-
76
-
77
-
78
-
79
-
80
-
81
-
82
-
83
-
84
-
85
-
86
-
87
-
88
-
89
-
90
-
91
-
92
-
93
-
94
-
95
-
96
-
97
-
98
-
99
-
100
-
101
-
102
-
103
-
104
-
105
-
106
-
107
-
108
-
109
-
110
-
111
-
112
-
113
-
114
-
115
-
116
-
117
-
118
-
119
-
120
-
121
-
122
-
123
-
124
-
125
-
126
-
127
-
128
-
129
-
130
-
131
-
132
-
133
-
134
-
135
-
136
-
137
-
138
-
139
-
140
-
141
-
142
-
143
-
144
-
145
-
146
-
147
-
148
-
149
-
150
-
151
-
152
-
153
-
154
-
155
-
156
-
157
-
158
-
159
-
160
-
161
-
162
-
163
-
164
-
165
-
166
-
167
-
168
-
169
-
170
-
171
-
172
-
173
-
174
-
175
-
176
-
177
-
178
-
179
-
180
-
181
-
182
-
183
-
184
-
185
-
186
-
187
-
188
-
189
-
190
-
191
-
192
-
193
-
194
-
195
-
196
-
197
-
198
-
199
-
200
-
201
-
202
-
203
-
204
-
205
-
206
-
207
-
208
-
209
-
210
-
211
-
212
-
213
-
214
-
215
-
216
-
217
-
218
-
219
-
220
-
221
-
222
-
223
-
224
-
225
-
226
-
227
-
228
-
229
-
230
-
231
-
232
-
233
-
234
-
235
-
236
-
237
-
238
-
239
-
240
-
241
-
242
-
243
-
244
-
245
-
246
-
247
-
248
-
249
-
250
-
251
-
252
-
253
-
254
-
255
-
256
-
257
-
258
-
259
-
260
-
261
-
262
-
263
-
264
-
265
-
266
-
267
-
268
-
269
-
270
-
271
-
272
-
273
-
274
-
275
-
276
-
277
-
278
-
279
-
280
-
281
-
282
-
283
-
284
-
285
-
286
-
287
-
288
-
289
-
290
-
291
-
292
-
293
-
294
-
295
-
296
-
297
-
298
-
299
-
300
-
301
-
302
-
303
-
304
-
305
-
306
-
307
-
308
-
309
-
310
-
311
-
312
-
313
-
314
-
315
-
316
-
317
-
318
-
319
-
320
-
321
-
322
-
323
-
324
-
325
-
326
-
327
-
328
-
329
-
330
-
331
-
332
-
333
-
334
-
335
-
336
-
337
-
338
-
339
-
340
-
341
-
342
-
343
-
344
-
345
-
346
-
347
-
348
-
349
-
350
-
351
-
352
-
353
-
354
-
355
-
356
-
357
-
358
-
359
-
360
-
361
-
362
-
363
-
364
-
365
-
366
-
367
-
368
-
369
-
370
-
371
-
372
-
373
-
374
-
375
-
376
-
377
-
378
-
379
-
380
-
381
-
382
-
383
-
384
-
385
-
386
-
 387
387 -
 388
388 -
 389
389 -
 390
390 -
 391
391 -
 392
392 -
 393
393 -
 394
394 -
 395
395 -
 396
396 -
 397
397 -
 398
398 -
 399
399 -
 400
400 -
 401
401 -
 402
402 -
 403
403 -
 404
404 -
 405
405 -
 406
406 -
 407
407 -
408
-
409
-
410
-
411
-
412
-
413
-
414
-
415
-
416
-
417
-
418
-
419
-
420
-
421
-
422
-
423
-
424
 |
 |
395
For fair value hedges recognised under IFRSs, no corresponding, offsetting fair value movement of the hedged
item with respect to the hedged risk has been recorded for US GAAP purposes. For hedging relationships
designated as at fair value for IFRSs purposes, no fair value movement in respect of own debt is recorded under
US GAAP.
The effect of this was to decrease US GAAP net income by US$1,266 million, net of elimination of a loss under
IFRS of US$76 million of own credit spread, outside North America.
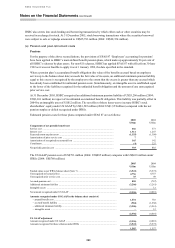
Fair value option
2005 only
HSBC has also applied the fair value option under IFRSs to groups of financial assets and liabilities which are
managed and evaluated on a fair value basis, and to financial instruments containing embedded derivatives (see
Note 3). In addition, movements in the fair value of certain liabilities which meet the definition of ‘held for
trading’ under IAS 39 are taken through net income. US GAAP does not include a fair value election and does
not generally permit liabilities to be reported at fair value. The elimination of such accounting reduced US
GAAP net income for 2005 by US$733 million.
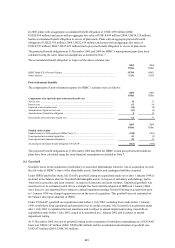
(e) Foreign exchange gains on available-for-sale securities
HSBC holds, in a number of different currencies, securities which are classified as available-for-sale within
individual legal entities. For example, in the private bank in Switzerland, for which the US dollar is the reporting
currency, the Group holds euro-denominated bonds funded in euros and Swiss franc securities funded in Swiss
francs. No foreign exchange exposure arises from this because, although the value of the assets in US dollars
changes with the exchange rate, there is an identical offsetting change in the US dollar value of the related
funding. Under IFRSs both the assets and the liabilities are translated at closing exchange rates and the
differences between historical book value and current value are reflected in foreign exchange dealing profits.
This reflects the economic substance of holding currency assets financed by currency liabilities.
However, under US GAAP, SFAS 115 and Emerging Issues Task Force (‘EITF’) Abstract 96-15 ‘Accounting
for the Effects of Changes in Foreign Currency Exchange Rates on Foreign-currency-denominated Available-
for-sale Debt Securities’ the change in value of the investments classified as available-for-sale is taken directly
to reserves while the offsetting change in US dollar terms of the borrowing is taken to earnings. This leads to an
accounting result which, although in compliance with US GAAP, does not necessarily reflect either the
underlying risk position or the economics of the transactions. It is also a situation that will reverse on maturity of
the asset or earlier sale. A similar difference arises when foreign currency exposures on foreign currency assets
are covered using forward contracts but HSBC does not manage these hedges to conform with the detailed hedge
designation requirements of SFAS 133.
The result is that for 2005, US GAAP net income increased by US$2,235 million (2004: increased by
US$1,069 million) compared with IFRSs net income. There was no difference in total shareholders’ equity
between IFRSs and US GAAP as a result of this reconciling item.
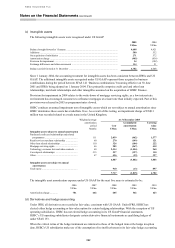
The adjustment for 2005 and 2004 largely reflects the reversal of adjustments in prior periods on the maturity or
disposal of securities. The impact in 2005 also included increased US GAAP net income as a result of a
strengthening of the US and Hong Kong dollar against the principal currencies in which HSBC hold available for
sale securities. The impact in 2004 was offset by the effect of a weakening in the US and Hong Kong dollar
against these principal currencies.
(f) Investment securities
Under US GAAP, HSBC’s financial investments with a readily determinable market value are classified as
available-for-sale securities, except for certain securities held by Republic New York Corporation at acquisition,
which were classified as held-to-maturity. All other securities are categorised as trading securities.
HSBC has taken advantage of the exemption within IFRS 1 from presenting comparative information for 2004 in
accordance with IAS 32 and IAS 39. Consequently, comparative IFRSs information has been prepared in
accordance with HSBC’s previous accounting policies, disclosed separately in Note 46(g).