HSBC 2005 Annual Report Download - page 77
Download and view the complete annual report
Please find page 77 of the 2005 HSBC annual report below. You can navigate through the pages in the report by either clicking on the pages listed below, or by using the keyword search tool below to find specific information within the annual report.-
 1
1 -
2
-
3
-
4
-
5
-
6
-
7
-
8
-
9
-
10
-
11
-
12
-
13
-
14
-
15
-
16
-
17
-
18
-
19
-
20
-
21
-
22
-
23
-
24
-
25
-
26
-
27
-
28
-
29
-
30
-
31
-
32
-
33
-
34
-
35
-
36
-
37
-
38
-
39
-
40
-
41
-
42
-
43
-
44
-
45
-
46
-
47
-
48
-
49
-
50
-
51
-
52
-
53
-
54
-
55
-
56
-
57
-
58
-
59
-
60
-
61
-
62
-
63
-
64
-
65
-
66
-
 67
67 -
 68
68 -
 69
69 -
 70
70 -
 71
71 -
 72
72 -
 73
73 -
 74
74 -
 75
75 -
 76
76 -
 77
77 -
 78
78 -
 79
79 -
 80
80 -
 81
81 -
 82
82 -
 83
83 -
 84
84 -
 85
85 -
 86
86 -
 87
87 -
88
-
89
-
90
-
91
-
92
-
93
-
94
-
95
-
96
-
97
-
98
-
99
-
100
-
101
-
102
-
103
-
104
-
105
-
106
-
107
-
108
-
109
-
110
-
111
-
112
-
113
-
114
-
115
-
116
-
117
-
118
-
119
-
120
-
121
-
122
-
123
-
124
-
125
-
126
-
127
-
128
-
129
-
130
-
131
-
132
-
133
-
134
-
135
-
136
-
137
-
138
-
139
-
140
-
141
-
142
-
143
-
144
-
145
-
146
-
147
-
148
-
149
-
150
-
151
-
152
-
153
-
154
-
155
-
156
-
157
-
158
-
159
-
160
-
161
-
162
-
163
-
164
-
165
-
166
-
167
-
168
-
169
-
170
-
171
-
172
-
173
-
174
-
175
-
176
-
177
-
178
-
179
-
180
-
181
-
182
-
183
-
184
-
185
-
186
-
187
-
188
-
189
-
190
-
191
-
192
-
193
-
194
-
195
-
196
-
197
-
198
-
199
-
200
-
201
-
202
-
203
-
204
-
205
-
206
-
207
-
208
-
209
-
210
-
211
-
212
-
213
-
214
-
215
-
216
-
217
-
218
-
219
-
220
-
221
-
222
-
223
-
224
-
225
-
226
-
227
-
228
-
229
-
230
-
231
-
232
-
233
-
234
-
235
-
236
-
237
-
238
-
239
-
240
-
241
-
242
-
243
-
244
-
245
-
246
-
247
-
248
-
249
-
250
-
251
-
252
-
253
-
254
-
255
-
256
-
257
-
258
-
259
-
260
-
261
-
262
-
263
-
264
-
265
-
266
-
267
-
268
-
269
-
270
-
271
-
272
-
273
-
274
-
275
-
276
-
277
-
278
-
279
-
280
-
281
-
282
-
283
-
284
-
285
-
286
-
287
-
288
-
289
-
290
-
291
-
292
-
293
-
294
-
295
-
296
-
297
-
298
-
299
-
300
-
301
-
302
-
303
-
304
-
305
-
306
-
307
-
308
-
309
-
310
-
311
-
312
-
313
-
314
-
315
-
316
-
317
-
318
-
319
-
320
-
321
-
322
-
323
-
324
-
325
-
326
-
327
-
328
-
329
-
330
-
331
-
332
-
333
-
334
-
335
-
336
-
337
-
338
-
339
-
340
-
341
-
342
-
343
-
344
-
345
-
346
-
347
-
348
-
349
-
350
-
351
-
352
-
353
-
354
-
355
-
356
-
357
-
358
-
359
-
360
-
361
-
362
-
363
-
364
-
365
-
366
-
367
-
368
-
369
-
370
-
371
-
372
-
373
-
374
-
375
-
376
-
377
-
378
-
379
-
380
-
381
-
382
-
383
-
384
-
385
-
386
-
387
-
388
-
389
-
390
-
391
-
392
-
393
-
394
-
395
-
396
-
397
-
398
-
399
-
400
-
401
-
402
-
403
-
404
-
405
-
406
-
407
-
408
-
409
-
410
-
411
-
412
-
413
-
414
-
415
-
416
-
417
-
418
-
419
-
420
-
421
-
422
-
423
-
424
 |
 |
75
stronger growth in private capital investment. The
tightening of the labour market boosted employment
and led to a sustained rise in real wages for the first
time in five years, providing strong support for
consumer spending. The rise in the core consumer
price index in November 2005 set the stage for the
end of the Bank of Japan’s quantitative easing policy.
Elsewhere in the region, most economies
performed impressively in 2005, in particular India’s.
The main drivers of growth were exports, demand for
technology, and domestic consumption. Investment
demand, by contrast, remained weak. Strong
domestic growth and continued firmness in energy
prices resulted in an increase in inflationary
pressures, especially in Indonesia and Thailand,
where fuel subsidies were lowered or removed.
Central banks in both these countries increased rates
substantially. Elsewhere, particularly in South Korea
and Taiwan, energy prices did not significantly affect
headline inflation, and the benign inflationary
environment was maintained with less need for
monetary tightening. Most Asian currencies ended
the year strongly against the US dollar.
2005 was a good year economically for the
Middle East, where growth was boosted by high oil
prices and additional capacity in downstream oil and
gas, real estate, transportation and tourism. Long-
term growth was reinforced through economic
liberalisation. The result was to encourage private
sector investment in both established and new sectors
of the region’s economy. Regional interest rates
mirrored US dollar rate increases during the year
without any noticeable effect on credit growth,
though inflationary pressures arose from the US
dollar’s weakness and general economic expansion.
GDP growth is estimated by the International
Monetary Fund to have been over 6 per cent in Saudi
Arabia in 2005. Economies in the region which are
not as dependent on oil also performed well, with the
United Arab Emirates, for example, registering
strong growth in non-oil sectors such as financial
services and tourism.
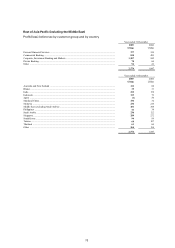
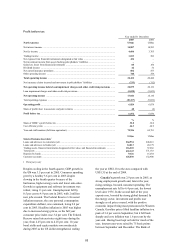
HSBC’s operations in the Rest of Asia-Pacific
reported a pre-tax profit of US$2,574 million,
compared with US$1,847 million in 2004,
representing an increase of 39 per cent. On an
underlying basis, pre-tax profits grew by 29 per cent
and represented around 12 per cent of HSBC’s
equivalent total profit. Strong growth across the
majority of countries in the region resulted in higher
revenues across all customer groups.
The commentary that follows is on an underlying
basis.
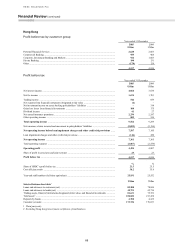
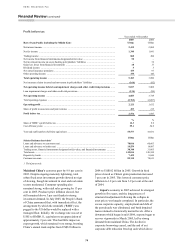
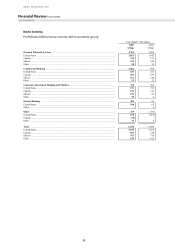
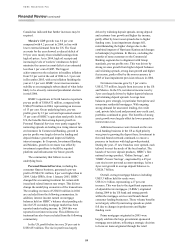
Personal Financial Services reported a pre-tax
profit of US$377 million, an increase of 6 per cent
compared with 2004, reflecting higher net interest
income led by strong asset and deposit growth,
increased fee income and higher income from
investments in the Middle East and mainland China.
Costs in support of business expansion rose and were
broadly in line with revenue growth. Higher loan
impairment charges reflected growth in credit card
lending and the non-recurrence in 2005 of loan
impairment provision releases in 2004.
Net interest income grew by 25 per cent to
US$1,208 million, reflecting strong growth across
the majority of countries in the region. Deposit
balances generally grew strongly during 2005. This
was due in part to the range of new products
launched during the year, including dual currency,
floating rate and higher-yielding time deposits. The
number of Premier account holders rose
significantly, with a 40 per cent growth across the
region generating US$3.5 billion of additional
balances. In mainland China, organic expansion
continued, with the opening of ten new branches and
sub-branches. The deposit base grew by 80 per cent,
as considerable emphasis was placed on the provision
of wealth management services through the HSBC
Premier account service. Deposit spreads also
widened as interest rates rose, contributing to higher
net interest income in mainland China, Singapore and
India.
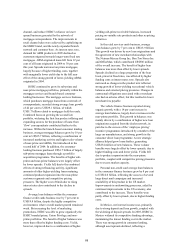
In the Middle East, a rise of 37 per cent in net
interest income was driven by a combination of
widening deposit spreads and strong loan growth,
partly offset by lower asset spreads as funding costs
increased following interest rate rises.
Average mortgage balances increased by 27 per
cent to US$16.7 billion. This growth reflected
marketing campaigns in India, Malaysia and
Singapore alongside new products introduced in
Australia and Korea. Higher sales volumes were also
generated by direct sales forces across the region,
notably in India, where mortgage balances grew by
43 per cent. The benefits of higher mortgage balances
were partly offset by lower spreads as pricing stayed
highly competitive.
The credit card business continued to expand in
a number of countries. Credit card spending
increased by 33 per cent, contributing to a 42 per cent
growth in average card balances. Other notable
developments included promotional campaigns, new
product launches and a series of customer acquisition
strategies including the exclusive rewards
programme, ‘Home and Away’. At the end of the
year, the number of cards in circulation stood at