HSBC 2005 Annual Report Download - page 403
Download and view the complete annual report
Please find page 403 of the 2005 HSBC annual report below. You can navigate through the pages in the report by either clicking on the pages listed below, or by using the keyword search tool below to find specific information within the annual report.-
 1
1 -
2
-
3
-
4
-
5
-
6
-
7
-
8
-
9
-
10
-
11
-
12
-
13
-
14
-
15
-
16
-
17
-
18
-
19
-
20
-
21
-
22
-
23
-
24
-
25
-
26
-
27
-
28
-
29
-
30
-
31
-
32
-
33
-
34
-
35
-
36
-
37
-
38
-
39
-
40
-
41
-
42
-
43
-
44
-
45
-
46
-
47
-
48
-
49
-
50
-
51
-
52
-
53
-
54
-
55
-
56
-
57
-
58
-
59
-
60
-
61
-
62
-
63
-
64
-
65
-
66
-
67
-
68
-
69
-
70
-
71
-
72
-
73
-
74
-
75
-
76
-
77
-
78
-
79
-
80
-
81
-
82
-
83
-
84
-
85
-
86
-
87
-
88
-
89
-
90
-
91
-
92
-
93
-
94
-
95
-
96
-
97
-
98
-
99
-
100
-
101
-
102
-
103
-
104
-
105
-
106
-
107
-
108
-
109
-
110
-
111
-
112
-
113
-
114
-
115
-
116
-
117
-
118
-
119
-
120
-
121
-
122
-
123
-
124
-
125
-
126
-
127
-
128
-
129
-
130
-
131
-
132
-
133
-
134
-
135
-
136
-
137
-
138
-
139
-
140
-
141
-
142
-
143
-
144
-
145
-
146
-
147
-
148
-
149
-
150
-
151
-
152
-
153
-
154
-
155
-
156
-
157
-
158
-
159
-
160
-
161
-
162
-
163
-
164
-
165
-
166
-
167
-
168
-
169
-
170
-
171
-
172
-
173
-
174
-
175
-
176
-
177
-
178
-
179
-
180
-
181
-
182
-
183
-
184
-
185
-
186
-
187
-
188
-
189
-
190
-
191
-
192
-
193
-
194
-
195
-
196
-
197
-
198
-
199
-
200
-
201
-
202
-
203
-
204
-
205
-
206
-
207
-
208
-
209
-
210
-
211
-
212
-
213
-
214
-
215
-
216
-
217
-
218
-
219
-
220
-
221
-
222
-
223
-
224
-
225
-
226
-
227
-
228
-
229
-
230
-
231
-
232
-
233
-
234
-
235
-
236
-
237
-
238
-
239
-
240
-
241
-
242
-
243
-
244
-
245
-
246
-
247
-
248
-
249
-
250
-
251
-
252
-
253
-
254
-
255
-
256
-
257
-
258
-
259
-
260
-
261
-
262
-
263
-
264
-
265
-
266
-
267
-
268
-
269
-
270
-
271
-
272
-
273
-
274
-
275
-
276
-
277
-
278
-
279
-
280
-
281
-
282
-
283
-
284
-
285
-
286
-
287
-
288
-
289
-
290
-
291
-
292
-
293
-
294
-
295
-
296
-
297
-
298
-
299
-
300
-
301
-
302
-
303
-
304
-
305
-
306
-
307
-
308
-
309
-
310
-
311
-
312
-
313
-
314
-
315
-
316
-
317
-
318
-
319
-
320
-
321
-
322
-
323
-
324
-
325
-
326
-
327
-
328
-
329
-
330
-
331
-
332
-
333
-
334
-
335
-
336
-
337
-
338
-
339
-
340
-
341
-
342
-
343
-
344
-
345
-
346
-
347
-
348
-
349
-
350
-
351
-
352
-
353
-
354
-
355
-
356
-
357
-
358
-
359
-
360
-
361
-
362
-
363
-
364
-
365
-
366
-
367
-
368
-
369
-
370
-
371
-
372
-
373
-
374
-
375
-
376
-
377
-
378
-
379
-
380
-
381
-
382
-
383
-
384
-
385
-
386
-
387
-
388
-
389
-
390
-
391
-
392
-
 393
393 -
 394
394 -
 395
395 -
 396
396 -
 397
397 -
 398
398 -
 399
399 -
 400
400 -
 401
401 -
 402
402 -
 403
403 -
 404
404 -
 405
405 -
 406
406 -
 407
407 -
 408
408 -
 409
409 -
 410
410 -
 411
411 -
 412
412 -
 413
413 -
414
-
415
-
416
-
417
-
418
-
419
-
420
-
421
-
422
-
423
-
424
 |
 |
401
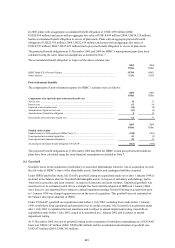
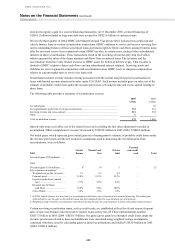
Cash flows received from securitisation trusts were as follows:
Real estate
secured
Vehicle
finance
MasterCard/
Visa
Private
label
Personal
non-credit
card Total
US$m US$m US$m US$m US$m US$m
2005
Proceeds from initial
securitisations ..................... ––––––
Servicing fees received ............ –45975099291
Other cash flows received on
retained interests1 ................ – (30) 239 109 (2) 316
2004
Proceeds from initial
securitisations ..................... – – 550 190 – 740
Servicing fees received ............ 1 86 185 93 161 526
Other cash flows received on
retained interests1 ................ 4 (9) 705 252 80 1,032
1Other cash flows included all cash flows from interest-only strip receivables, excluding servicing fees.
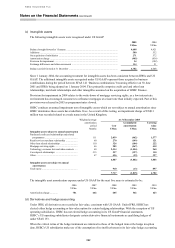
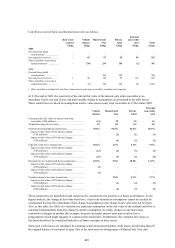
At 31 December 2005, the sensitivity of the current fair value of the interest-only strip receivables to an
immediate 10 per cent and 20 per cent unfavourable change in assumptions are presented in the table below.
These sensitivities are based on assumptions used to value interest-only strip receivables at 31 December 2005.
Vehicle
finance
MasterCard/
Visa
Private
label
Personal
non-credit
card
Carrying value (fair value) of interest-only strip
receivables (US$ millions) .............................................. (13) 20 15 16
Weighted average life (in years) .......................................... 1.2 0.3 0.5 0.5
Payment speed assumption (annual rate) ............................. 55.8% 96.3% 82.8% 86.9%
Impact on fair value of 10% adverse change
(US$ millions) ............................................................ – (2) (1) (1)
Impact on fair value of 20% adverse change
(US$ millions) ............................................................ – (4) (2) (2)
Expected credit losses (annual rate) .................................... 10.6% 4.6% 4.9% 9.4%
Impact on fair value of 10% adverse change
(US$ millions) ............................................................ (12) (2) (3) (4)
Impact on fair value of 20% adverse change
(US$ millions) ............................................................ (25) (3) (6) (8)
Discount rate for residual cash flows (annual rate) .............. 10.0% 9.0% 10.0% 11.0%
Impact on fair value of 10% adverse change
(US$ millions) ............................................................ (2) – – –
Impact on fair value of 20% adverse change
(US$ millions) ............................................................ (3) – – –
Variable returns to investors (annual rate) ........................... – 2.9% 5.1% 5.7%
Impact on fair value of 10% adverse change
(US$ millions) ............................................................ – (1) (4) (2)
Impact on fair value of 20% adverse change
(US$ millions) ............................................................ – (2) (7) (5)
These sensitivities are hypothetical and should not be considered to be predictive of future performance. As the
figures indicate, the change in fair value based on a 10 per cent variation in assumptions cannot necessarily be
extrapolated because the relationship of the change in assumption to the change in fair value may not be linear.
Also, in this table, the effect of a variation in a particular assumption on the fair value of the residual cash flow is
calculated independently from any change in another assumption. In reality, changes in one factor may
contribute to changes in another (for example, increases in market interest rates may result in lower
prepayments) which might magnify or counteract the sensitivities. Furthermore, the estimated fair values as
disclosed should not be considered indicative of future earnings on these assets.
Static pool credit losses are calculated by summing actual and projected future credit losses and dividing them by
the original balance of each pool of asset. Due to the short-term revolving nature of MasterCard, Visa, and