HSBC 2005 Annual Report Download - page 162
Download and view the complete annual report
Please find page 162 of the 2005 HSBC annual report below. You can navigate through the pages in the report by either clicking on the pages listed below, or by using the keyword search tool below to find specific information within the annual report.-
 1
1 -
2
-
3
-
4
-
5
-
6
-
7
-
8
-
9
-
10
-
11
-
12
-
13
-
14
-
15
-
16
-
17
-
18
-
19
-
20
-
21
-
22
-
23
-
24
-
25
-
26
-
27
-
28
-
29
-
30
-
31
-
32
-
33
-
34
-
35
-
36
-
37
-
38
-
39
-
40
-
41
-
42
-
43
-
44
-
45
-
46
-
47
-
48
-
49
-
50
-
51
-
52
-
53
-
54
-
55
-
56
-
57
-
58
-
59
-
60
-
61
-
62
-
63
-
64
-
65
-
66
-
67
-
68
-
69
-
70
-
71
-
72
-
73
-
74
-
75
-
76
-
77
-
78
-
79
-
80
-
81
-
82
-
83
-
84
-
85
-
86
-
87
-
88
-
89
-
90
-
91
-
92
-
93
-
94
-
95
-
96
-
97
-
98
-
99
-
100
-
101
-
102
-
103
-
104
-
105
-
106
-
107
-
108
-
109
-
110
-
111
-
112
-
113
-
114
-
115
-
116
-
117
-
118
-
119
-
120
-
121
-
122
-
123
-
124
-
125
-
126
-
127
-
128
-
129
-
130
-
131
-
132
-
133
-
134
-
135
-
136
-
137
-
138
-
139
-
140
-
141
-
142
-
143
-
144
-
145
-
146
-
147
-
148
-
149
-
150
-
151
-
 152
152 -
 153
153 -
 154
154 -
 155
155 -
 156
156 -
 157
157 -
 158
158 -
 159
159 -
 160
160 -
 161
161 -
 162
162 -
 163
163 -
 164
164 -
 165
165 -
 166
166 -
 167
167 -
 168
168 -
 169
169 -
 170
170 -
 171
171 -
 172
172 -
173
-
174
-
175
-
176
-
177
-
178
-
179
-
180
-
181
-
182
-
183
-
184
-
185
-
186
-
187
-
188
-
189
-
190
-
191
-
192
-
193
-
194
-
195
-
196
-
197
-
198
-
199
-
200
-
201
-
202
-
203
-
204
-
205
-
206
-
207
-
208
-
209
-
210
-
211
-
212
-
213
-
214
-
215
-
216
-
217
-
218
-
219
-
220
-
221
-
222
-
223
-
224
-
225
-
226
-
227
-
228
-
229
-
230
-
231
-
232
-
233
-
234
-
235
-
236
-
237
-
238
-
239
-
240
-
241
-
242
-
243
-
244
-
245
-
246
-
247
-
248
-
249
-
250
-
251
-
252
-
253
-
254
-
255
-
256
-
257
-
258
-
259
-
260
-
261
-
262
-
263
-
264
-
265
-
266
-
267
-
268
-
269
-
270
-
271
-
272
-
273
-
274
-
275
-
276
-
277
-
278
-
279
-
280
-
281
-
282
-
283
-
284
-
285
-
286
-
287
-
288
-
289
-
290
-
291
-
292
-
293
-
294
-
295
-
296
-
297
-
298
-
299
-
300
-
301
-
302
-
303
-
304
-
305
-
306
-
307
-
308
-
309
-
310
-
311
-
312
-
313
-
314
-
315
-
316
-
317
-
318
-
319
-
320
-
321
-
322
-
323
-
324
-
325
-
326
-
327
-
328
-
329
-
330
-
331
-
332
-
333
-
334
-
335
-
336
-
337
-
338
-
339
-
340
-
341
-
342
-
343
-
344
-
345
-
346
-
347
-
348
-
349
-
350
-
351
-
352
-
353
-
354
-
355
-
356
-
357
-
358
-
359
-
360
-
361
-
362
-
363
-
364
-
365
-
366
-
367
-
368
-
369
-
370
-
371
-
372
-
373
-
374
-
375
-
376
-
377
-
378
-
379
-
380
-
381
-
382
-
383
-
384
-
385
-
386
-
387
-
388
-
389
-
390
-
391
-
392
-
393
-
394
-
395
-
396
-
397
-
398
-
399
-
400
-
401
-
402
-
403
-
404
-
405
-
406
-
407
-
408
-
409
-
410
-
411
-
412
-
413
-
414
-
415
-
416
-
417
-
418
-
419
-
420
-
421
-
422
-
423
-
424
 |
 |

HSBC HOLDINGS PLC
Financial Review (continued)
160
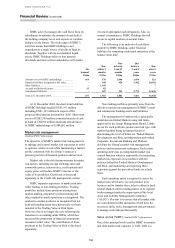
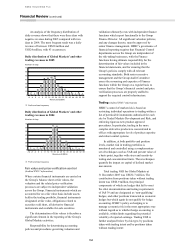
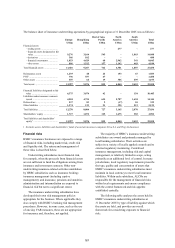
The objectives of HSBC Holdings’ market risk
management are to minimise income statement
volatility arising from short-term cash balances and
funding positions; to minimise the market risk
arising from long-term investments and long-term
liabilities; and to protect distributable reserves from
the adverse impact of market risk variables.
Market risk for HSBC Holdings is monitored
by its ALCO.
The main market risks to which HSBC
Holdings is exposed are interest rate risk and
foreign currency risk.
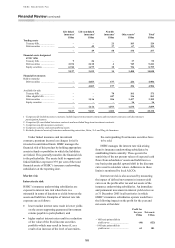
HSBC Holdings is exposed to interest rate risk
on debt capital investments in, and loans to,
subsidiary undertakings; on debt capital issues; and
on short-term cash resources.
Following the adoption of IFRSs, certain loans
to subsidiary undertakings of a capital nature that
are not denominated in the functional currency of
either the provider or the recipient are accounted
for as financial assets. Changes in the carrying
amount of these assets due to exchange differences
are taken directly to the income statement. Prior to
the adoption of IFRSs, such exchange differences
were taken directly to reserves. These loans, and
the associated foreign exchange exposures, are
eliminated on a Group consolidated basis.
Revaluations due to foreign exchange rate
movements of loans to subsidiary undertakings of a
capital nature, and which are denominated in the
functional currency of either the borrower or the
recipient, are taken directly to reserves. Equity
investments in subsidiary undertakings are
accounted for on a cost basis and are not revalued
following movements in exchange rates.
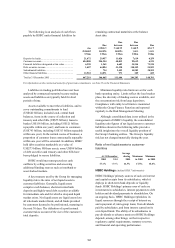
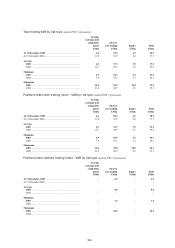
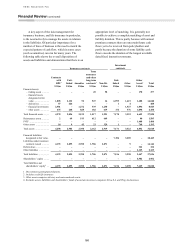
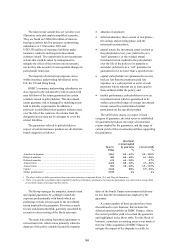
Total VAR arising within HSBC Holdings at
31 December 2005 was as follows:
Foreign
exchange
US$m
Interest
rates
US$m
Total
US$m
At 31 December
2005 .................. 26.1 36.1 51.4
At 31 December
2004 .................. 24.1 29.4 45.9
Average
2005 .................. 24.0 33.7 48.9
2004 .................. 21.8 34.2 52.4
Minimum
2005 .................. 22.0 29.6 42.6
2004 .................. 20.6 22.6 40.3
Maximum
2005 .................. 26.1 45.9 56.6
2004 .................. 24.1 47.2 68.4
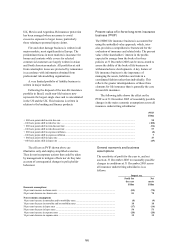
A principal tool in the management of market
risk is the projected sensitivity of HSBC Holdings’
net interest income to future changes in yield
curves.
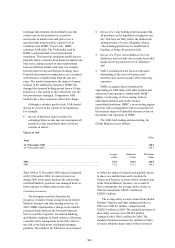
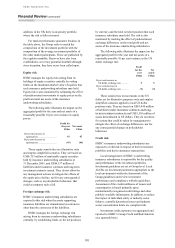
(Unaudited information)
The table below sets out the effect on HSBC
Holdings’ future net interest income of an
incremental 25 basis point parallel fall or rise in all
yield curves worldwide at the beginning of each
quarter during the 12 month period from 1 January
2006.
Assuming no management action, a series of
such rises would decrease HSBC Holdings’
planned net interest income for 2006 by
US$7 million while a series of such falls would
increase planned net interest income by
US$7 million. These figures incorporate the impact
of any option features in the underlying exposures.
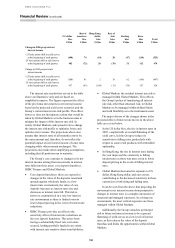
Unaudited information
US dollar
bloc
Sterling
bloc
Euro
bloc Total
US$m US$m US$m US$m
Change in 2006 projected net interest income
+ 25 basis points shift in yield curves at the beginning of each quarter ....... (18) 5 6 (7)
– 25 basis points shift in yield curves at the beginning of each quarter ....... 18 (5) (6) 7
Change in 2005 projected net interest income
+ 25 basis points shift in yield curves at the beginning of each quarter ....... (5) 6 4 5
– 25 basis points shift in yield curves at the beginning of each quarter ....... 5 (6) (4) (5)
HSBC Holdings’ principal exposure to changes
in its net interest income from movements in interest
rates arises on short-term cash balances, floating rate
loans advanced to subsidiary undertakings and fixed
rate debt capital securities in issue which have been
swapped to floating rate.
The interest rate sensitivities set out in the table
above are illustrative only and are based on
simplified scenarios. The figures represent the effect
of pro forma movements in net interest income based
on the projected yield curve scenarios and HSBC
Holdings’ current interest rate risk profile. This