HSBC 2005 Annual Report Download - page 167
Download and view the complete annual report
Please find page 167 of the 2005 HSBC annual report below. You can navigate through the pages in the report by either clicking on the pages listed below, or by using the keyword search tool below to find specific information within the annual report.-
 1
1 -
2
-
3
-
4
-
5
-
6
-
7
-
8
-
9
-
10
-
11
-
12
-
13
-
14
-
15
-
16
-
17
-
18
-
19
-
20
-
21
-
22
-
23
-
24
-
25
-
26
-
27
-
28
-
29
-
30
-
31
-
32
-
33
-
34
-
35
-
36
-
37
-
38
-
39
-
40
-
41
-
42
-
43
-
44
-
45
-
46
-
47
-
48
-
49
-
50
-
51
-
52
-
53
-
54
-
55
-
56
-
57
-
58
-
59
-
60
-
61
-
62
-
63
-
64
-
65
-
66
-
67
-
68
-
69
-
70
-
71
-
72
-
73
-
74
-
75
-
76
-
77
-
78
-
79
-
80
-
81
-
82
-
83
-
84
-
85
-
86
-
87
-
88
-
89
-
90
-
91
-
92
-
93
-
94
-
95
-
96
-
97
-
98
-
99
-
100
-
101
-
102
-
103
-
104
-
105
-
106
-
107
-
108
-
109
-
110
-
111
-
112
-
113
-
114
-
115
-
116
-
117
-
118
-
119
-
120
-
121
-
122
-
123
-
124
-
125
-
126
-
127
-
128
-
129
-
130
-
131
-
132
-
133
-
134
-
135
-
136
-
137
-
138
-
139
-
140
-
141
-
142
-
143
-
144
-
145
-
146
-
147
-
148
-
149
-
150
-
151
-
152
-
153
-
154
-
155
-
156
-
 157
157 -
 158
158 -
 159
159 -
 160
160 -
 161
161 -
 162
162 -
 163
163 -
 164
164 -
 165
165 -
 166
166 -
 167
167 -
 168
168 -
 169
169 -
 170
170 -
 171
171 -
 172
172 -
 173
173 -
 174
174 -
 175
175 -
 176
176 -
 177
177 -
178
-
179
-
180
-
181
-
182
-
183
-
184
-
185
-
186
-
187
-
188
-
189
-
190
-
191
-
192
-
193
-
194
-
195
-
196
-
197
-
198
-
199
-
200
-
201
-
202
-
203
-
204
-
205
-
206
-
207
-
208
-
209
-
210
-
211
-
212
-
213
-
214
-
215
-
216
-
217
-
218
-
219
-
220
-
221
-
222
-
223
-
224
-
225
-
226
-
227
-
228
-
229
-
230
-
231
-
232
-
233
-
234
-
235
-
236
-
237
-
238
-
239
-
240
-
241
-
242
-
243
-
244
-
245
-
246
-
247
-
248
-
249
-
250
-
251
-
252
-
253
-
254
-
255
-
256
-
257
-
258
-
259
-
260
-
261
-
262
-
263
-
264
-
265
-
266
-
267
-
268
-
269
-
270
-
271
-
272
-
273
-
274
-
275
-
276
-
277
-
278
-
279
-
280
-
281
-
282
-
283
-
284
-
285
-
286
-
287
-
288
-
289
-
290
-
291
-
292
-
293
-
294
-
295
-
296
-
297
-
298
-
299
-
300
-
301
-
302
-
303
-
304
-
305
-
306
-
307
-
308
-
309
-
310
-
311
-
312
-
313
-
314
-
315
-
316
-
317
-
318
-
319
-
320
-
321
-
322
-
323
-
324
-
325
-
326
-
327
-
328
-
329
-
330
-
331
-
332
-
333
-
334
-
335
-
336
-
337
-
338
-
339
-
340
-
341
-
342
-
343
-
344
-
345
-
346
-
347
-
348
-
349
-
350
-
351
-
352
-
353
-
354
-
355
-
356
-
357
-
358
-
359
-
360
-
361
-
362
-
363
-
364
-
365
-
366
-
367
-
368
-
369
-
370
-
371
-
372
-
373
-
374
-
375
-
376
-
377
-
378
-
379
-
380
-
381
-
382
-
383
-
384
-
385
-
386
-
387
-
388
-
389
-
390
-
391
-
392
-
393
-
394
-
395
-
396
-
397
-
398
-
399
-
400
-
401
-
402
-
403
-
404
-
405
-
406
-
407
-
408
-
409
-
410
-
411
-
412
-
413
-
414
-
415
-
416
-
417
-
418
-
419
-
420
-
421
-
422
-
423
-
424
 |
 |

165
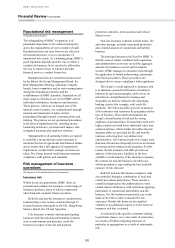
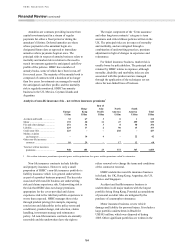
UK, Mexico and Argentina. Reinsurance protection
has been arranged where necessary to avoid
excessive exposure to larger losses, particularly
those relating to personal injury claims.
Fire and other damage business is written in all
major markets, most significantly in Europe. The
predominant focus in most markets is insurance for
homes and contents while covers for selected
commercial customers are largely written in Asian
and South American markets. All portfolios at risk
from catastrophic losses are protected by reinsurance
in accordance with information obtained from
professional risk-modelling organisations.
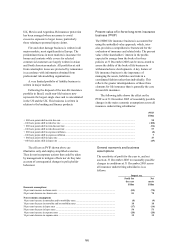
A very limited portfolio of liability business is
written in major markets.
Following the disposal of the non-life insurance
portfolio in Brazil, credit non-life business now
represents the largest single class and is concentrated
in the US and the UK. This business is written in
relation to the banking and finance products.
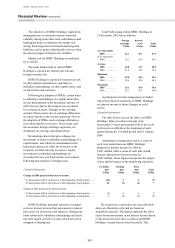
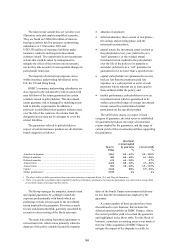
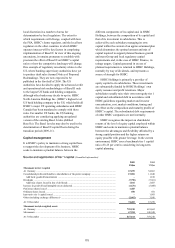
Present value of in-force long-term insurance
business (‘PVIF’)
The HSBC life insurance business is accounted for
using the embedded value approach, which, inter
alia, provides a comprehensive framework for the
evaluation of insurance and related risks. The present
value of the shareholders’ interest in the profits
expected to emerge from the book of in-force
policies at 31 December 2005 can be stress-tested to
assess the ability of the book of life business to
withstand adverse developments. A key feature of
life insurance business is the importance of
managing the assets, liabilities and risks in a
coordinated fashion rather than individually. This
reflects the greater interdependence of these three
elements for life insurance than is generally the case
for non-life insurance.
The following table shows the effect on the
PVIF as at 31 December 2005 of reasonably possible
changes in the main economic assumptions across all
insurance underwriting subsidiaries:
PVIF
US$m
+ 100 basis points shift in risk-free rate ........................................................................................................................... 90
– 100 basis points shift in risk-free rate ........................................................................................................................... (100)
+ 100 basis points shift in risk discount rate .................................................................................................................... (54)
– 100 basis points shift in risk discount rate .................................................................................................................... 57
+ 100 basis points shift in expenses inflation ................................................................................................................... (8)
– 100 basis points shift in expenses inflation ................................................................................................................... 7
+ 100 basis points shift in lapse rate ................................................................................................................................ 47
– 100 basis points shift in lapse rate ................................................................................................................................ (49)
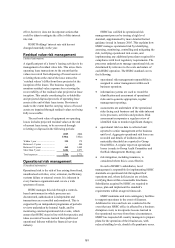
The effects on PVIF shown above are
illustrative only and employ simplified scenarios.
They do not incorporate actions that could be taken
by management to mitigate effects nor do they take
account of consequential changes in policyholder
behaviour.
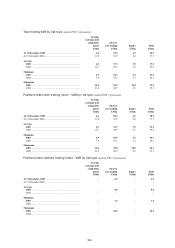
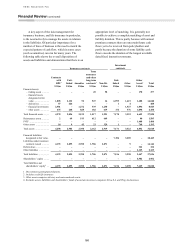
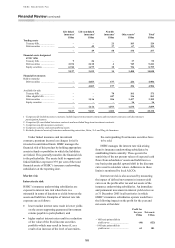
General economic and business
assumptions
The sensitivity of profit for the year to, and net
assets at, 31 December 2005 to reasonably possible
changes in conditions at 31 December 2005 across
all insurance underwriting subsidiaries is as
follows:
Impact on:
Profit for
the year
Net
assets
US$m US$m
Economic assumptions
20 per cent increase in claims costs ................................................................................................ (82) (78)
20 per cent decrease in claims costs ................................................................................................ 81 78
Non-economic assumptions
10 per cent increase in mortality and/or morbidity rates.................................................................. (8) (9)
10 per cent decrease in mortality and/or morbidity rates ................................................................. 18 18
50 per cent increase in lapse rates ................................................................................................... (17) (14)
50 per cent decrease in lapse rates................................................................................................... 56 51
10 per cent increase in expense rates .............................................................................................. (20) (20)
10 per cent decrease in expense rates .............................................................................................. 19 19