Xcel Energy 2012 Annual Report Download - page 92
Download and view the complete annual report
Please find page 92 of the 2012 Xcel Energy annual report below. You can navigate through the pages in the report by either clicking on the pages listed below, or by using the keyword search tool below to find specific information within the annual report.-
 1
1 -
2
-
3
-
4
-
5
-
6
-
7
-
8
-
9
-
10
-
11
-
12
-
13
-
14
-
15
-
16
-
17
-
18
-
19
-
20
-
21
-
22
-
23
-
24
-
25
-
26
-
27
-
28
-
29
-
30
-
31
-
32
-
33
-
34
-
35
-
36
-
37
-
38
-
39
-
40
-
41
-
42
-
43
-
44
-
45
-
46
-
47
-
48
-
49
-
50
-
51
-
52
-
53
-
54
-
55
-
56
-
57
-
58
-
59
-
60
-
61
-
62
-
63
-
64
-
65
-
66
-
67
-
68
-
69
-
70
-
71
-
72
-
73
-
74
-
75
-
76
-
77
-
78
-
79
-
80
-
81
-
 82
82 -
 83
83 -
 84
84 -
 85
85 -
 86
86 -
 87
87 -
 88
88 -
 89
89 -
 90
90 -
 91
91 -
 92
92 -
 93
93 -
 94
94 -
 95
95 -
 96
96 -
 97
97 -
 98
98 -
 99
99 -
 100
100 -
 101
101 -
 102
102 -
103
-
104
-
105
-
106
-
107
-
108
-
109
-
110
-
111
-
112
-
113
-
114
-
115
-
116
-
117
-
118
-
119
-
120
-
121
-
122
-
123
-
124
-
125
-
126
-
127
-
128
-
129
-
130
-
131
-
132
-
133
-
134
-
135
-
136
-
137
-
138
-
139
-
140
-
141
-
142
-
143
-
144
-
145
-
146
-
147
-
148
-
149
-
150
-
151
-
152
-
153
-
154
-
155
-
156
-
157
-
158
-
159
-
160
-
161
-
162
-
163
-
164
-
165
-
166
-
167
-
168
-
169
-
170
-
171
-
172
 |
 |

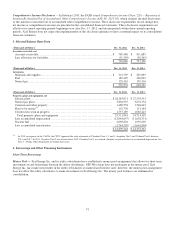
XCEL ENERGY INC. AND SUBSIDIARIES
CONSOLIDATED STATEMENTS OF COMMON STOCKHOLDERS’ EQUITY
(amounts in thousands)
See Notes to Consolidated Financial Statements
82
Common Stock Issued
Accumulated
Total
Additional
Other
Common
Paid In
Retained
Comprehensive
Stockholders’
Shares
Par Value
Capital
Earnings
Loss
Equity
Balance at Dec. 31, 2009
..........
457,509
$
1,143,773
$
4,769,980
$
1,419,201
$
(49,709)
$
7,283,245
Comprehensive income:
Net income
......................
755,834
755,834
Other comprehensive loss
........
(3,384)
(3,384)
Comprehensive income for 2010
....
752,450
Dividends declared:
Cumulative preferred stock
.......
(4,241
)
(4,241)
Common stock
..................
(469,091
)
(469,091)
Issuances of common stock
.........
24,825
62,061
426,717
488,778
Share-based compensation
.........
32,378
32,378
Balance at Dec. 31, 2010
..........
482,334
$
1,205,834
$
5,229,075
$
1,701,703
$
(53,093)
$
8,083,519
Comprehensive income:
Net income
......................
841,172
841,172
Other comprehensive loss
........
(40,942)
(40,942)
Comprehensive income for 2011
....
800,230
Dividends declared:
Cumulative preferred stock
.......
(3,534
)
(3,534)
Common stock
..................
(503,525
)
(503,525)
Premium on redemption of
preferred stock
..................
(3,260
)
(3,260)
Issuances of common stock
.........
4,160
10,400
54,514
64,914
Share-based compensation
.........
43,854
43,854
Balance at Dec. 31, 2011
..........
486,494
$
1,216,234
$
5,327,443
$
2,032,556
$
(94,035)
$
8,482,198
Comprehensive income:
Net income
......................
905,229
905,229
Other comprehensive loss
........
(18,618)
(18,618)
Comprehensive income for 2012
....
886,611
Dividends declared on common
stock
...........................
(523,969
)
(523,969)
Issuances of common stock
.........
2,166
5,415
28,219
33,634
Repurchase of common stock
.......
(700
)
(1,750
)
(16,779
)
(18,529)
Purchase of common stock for
settlement of equity awards
.........
(23,307
)
(23,307)
Share-based compensation
.........
37,439
37,439
Balance at Dec. 31, 2012
..........
487,960
$
1,219,899
$
5,353,015
$
2,413,816
$
(112,653)
$
8,874,077