Xcel Energy 2012 Annual Report Download - page 79
Download and view the complete annual report
Please find page 79 of the 2012 Xcel Energy annual report below. You can navigate through the pages in the report by either clicking on the pages listed below, or by using the keyword search tool below to find specific information within the annual report.-
 1
1 -
2
-
3
-
4
-
5
-
6
-
7
-
8
-
9
-
10
-
11
-
12
-
13
-
14
-
15
-
16
-
17
-
18
-
19
-
20
-
21
-
22
-
23
-
24
-
25
-
26
-
27
-
28
-
29
-
30
-
31
-
32
-
33
-
34
-
35
-
36
-
37
-
38
-
39
-
40
-
41
-
42
-
43
-
44
-
45
-
46
-
47
-
48
-
49
-
50
-
51
-
52
-
53
-
54
-
55
-
56
-
57
-
58
-
59
-
60
-
61
-
62
-
63
-
64
-
65
-
66
-
67
-
68
-
 69
69 -
 70
70 -
 71
71 -
 72
72 -
 73
73 -
 74
74 -
 75
75 -
 76
76 -
 77
77 -
 78
78 -
 79
79 -
 80
80 -
 81
81 -
 82
82 -
 83
83 -
 84
84 -
 85
85 -
 86
86 -
 87
87 -
 88
88 -
 89
89 -
90
-
91
-
92
-
93
-
94
-
95
-
96
-
97
-
98
-
99
-
100
-
101
-
102
-
103
-
104
-
105
-
106
-
107
-
108
-
109
-
110
-
111
-
112
-
113
-
114
-
115
-
116
-
117
-
118
-
119
-
120
-
121
-
122
-
123
-
124
-
125
-
126
-
127
-
128
-
129
-
130
-
131
-
132
-
133
-
134
-
135
-
136
-
137
-
138
-
139
-
140
-
141
-
142
-
143
-
144
-
145
-
146
-
147
-
148
-
149
-
150
-
151
-
152
-
153
-
154
-
155
-
156
-
157
-
158
-
159
-
160
-
161
-
162
-
163
-
164
-
165
-
166
-
167
-
168
-
169
-
170
-
171
-
172
 |
 |

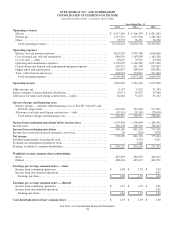
69
(Millions of Dollars)
2012
2011
2010
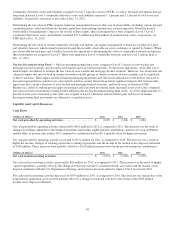
Net cash provided by (used in) financing activities ............... $
350
$
(205
)
$
906
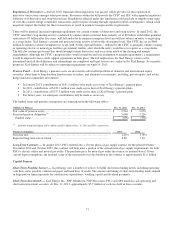
Net cash provided by financing activities increased by $555 million for 2012 as compared to 2011. The increase was primarily
due to higher proceeds from short-term borrowings and the issuance of long-term debt, partially offset by repayments of
previously existing long-term debt, repurchases of common stock and higher dividend payments.
Net cash used in financing activities increased by $1.1 billion during 2011 as compared to 2010. The increase was primarily due
to lower proceeds from the issuance of long-term debt and common stock in 2011 and the redemption of preferred stock during
2011.
See discussion of trends, commitments and uncertainties with the potential for future impact on cash flow and liquidity under
Capital Sources.
Capital Requirements
Xcel Energy expects to meet future financing requirements by periodically issuing short-term debt, long-term debt, common
stock, hybrid and other securities to maintain desired capitalization ratios.
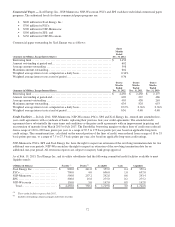
Capital Expenditures — The current estimated capital expenditure programs of Xcel Energy Inc. and its subsidiaries for the years
2013 through 2017 are shown in the table below. The capital expenditure forecast reflects the termination of the Prairie Island
EPU.
Actual
Forecast
(Millions of Dollars)
2012
2013
2014
2015
2016
2017
By Subsidiary
NSP-Minnesota .................................. $ 1,018
$ 1,395
$ 1,135
$ 910
$ 925
$ 1,080
PSCo ............................................
887
1,075
1,000
850
800
840
SPS .............................................
389
490
400
305
300
345
NSP-Wisconsin ..................................
155
180
240
245
230
235
WYCO ..........................................
1
15
-
-
-
-
Total capital expenditures ....................... $ 2,450
$ 3,155
$ 2,775
$ 2,310
$ 2,255
$ 2,500
By Function
2012
2013
2014
2015
2016
2017
Electric generation................................ $ 772
$ 1,025
$ 710
$ 550
$ 465
$ 570
Electric transmission..............................
734
1,010
870
650
635
770
Electric distribution ...............................
486
515
525
525
535
545
Natural gas.......................................
247
355
365
335
325
320
Nuclear fuel......................................
53
95
155
100
140
145
Other ............................................
158
155
150
150
155
150
Total capital expenditures ....................... $ 2,450
$ 3,155
$ 2,775
$ 2,310
$ 2,255
$ 2,500
By Project
2012
2013
2014
2015
2016
2017
Other capital expenditures......................... $ 1,720
$ 1,710
$ 1,610
$ 1,555
$ 1,600
$ 1,755
PSCo CACJA ....................................
189
345
235
90
15
-
Other major transmission projects ..................
179
245
260
175
320
415
CapX2020 transmission project ....................
170
350
295
140
-
-
Natural gas pipeline replacement...................
100
140
170
190
130
135
Nuclear fuel......................................
53
95
155
100
140
145
Nuclear capacity increases and life extension .......
39
270
50
60
50
50
Total capital expenditures ....................... $ 2,450
$ 3,155
$ 2,775
$ 2,310
$ 2,255
$ 2,500
The capital expenditure programs of Xcel Energy are subject to continuing review and modification. Actual utility construction
expenditures may vary from the estimates due to changes in electric and natural gas projected load growth, regulatory decisions,
legislative initiatives, reserve margins, the availability of purchased power, alternative plans for meeting long-term energy needs,
compliance with future environmental requirements, RPS, and merger, acquisition and divestiture opportunities to support
corporate strategies.