Xcel Energy 2012 Annual Report Download - page 116
Download and view the complete annual report
Please find page 116 of the 2012 Xcel Energy annual report below. You can navigate through the pages in the report by either clicking on the pages listed below, or by using the keyword search tool below to find specific information within the annual report.-
 1
1 -
2
-
3
-
4
-
5
-
6
-
7
-
8
-
9
-
10
-
11
-
12
-
13
-
14
-
15
-
16
-
17
-
18
-
19
-
20
-
21
-
22
-
23
-
24
-
25
-
26
-
27
-
28
-
29
-
30
-
31
-
32
-
33
-
34
-
35
-
36
-
37
-
38
-
39
-
40
-
41
-
42
-
43
-
44
-
45
-
46
-
47
-
48
-
49
-
50
-
51
-
52
-
53
-
54
-
55
-
56
-
57
-
58
-
59
-
60
-
61
-
62
-
63
-
64
-
65
-
66
-
67
-
68
-
69
-
70
-
71
-
72
-
73
-
74
-
75
-
76
-
77
-
78
-
79
-
80
-
81
-
82
-
83
-
84
-
85
-
86
-
87
-
88
-
89
-
90
-
91
-
92
-
93
-
94
-
95
-
96
-
97
-
98
-
99
-
100
-
101
-
102
-
103
-
104
-
105
-
 106
106 -
 107
107 -
 108
108 -
 109
109 -
 110
110 -
 111
111 -
 112
112 -
 113
113 -
 114
114 -
 115
115 -
 116
116 -
 117
117 -
 118
118 -
 119
119 -
 120
120 -
 121
121 -
 122
122 -
 123
123 -
 124
124 -
 125
125 -
 126
126 -
127
-
128
-
129
-
130
-
131
-
132
-
133
-
134
-
135
-
136
-
137
-
138
-
139
-
140
-
141
-
142
-
143
-
144
-
145
-
146
-
147
-
148
-
149
-
150
-
151
-
152
-
153
-
154
-
155
-
156
-
157
-
158
-
159
-
160
-
161
-
162
-
163
-
164
-
165
-
166
-
167
-
168
-
169
-
170
-
171
-
172
 |
 |

106
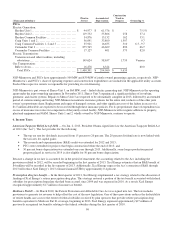
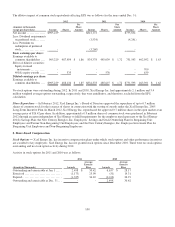
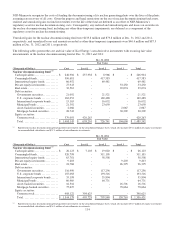
Purchases,
Net Realized
Net Unrealized
Issuances, and
(Thousands of Dollars)
Jan. 1, 2011
Gains (Losses)
Gains (Losses)
Settlements, Net
Dec. 31, 2011
Asset-backed securities
..........................
$ 26,986
$ 2,391
$
(2,504
)
$
4,495
$
31,368
Mortgage-backed securities
.......................
113,418
1,103
(5,926
)
(35,073
)
73,522
Private equity investments
........................
122,223
3,971
12,412
20,757
159,363
Real estate ................................
......
73,701
(629
)
20,271
(56,237
)
37,106
Total................................
..........
$ 336,328
$ 6,836
$
24,253
$
(66,058
)
$
301,359
Purchases,
Net Realized
Net Unrealized
Issuances, and
(Thousands of Dollars)
Jan. 1, 2010
Gains (Losses)
Gains (Losses)
Settlements, Net
Dec. 31, 2010
Asset-backed securities
..........................
$ 47,825
$ 3,400
$
(7,078
)
$
(17,161
)
$
26,986
Mortgage-backed securities
.......................
144,006
13,719
(19,095
)
(25,212
)
113,418
Private equity investments
........................
82,098
(1,008
)
(24
)
41,157
122,223
Real estate ................................
......
66,704
(1,135
)
8,235
(103
)
73,701
Total................................
..........
$ 340,633
$ 14,976
$
(17,962
)
$
(1,319
)
$
336,328
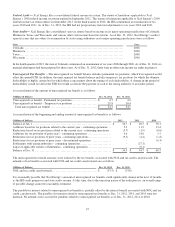
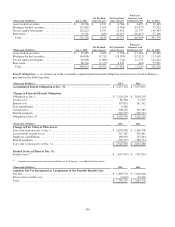
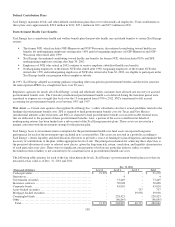
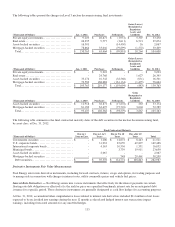
Benefit Obligations — A comparison of the actuarially computed pension benefit obligation and plan assets for Xcel Energy is
presented in the following table:
(Thousands of Dollars)
2012
2011
Accumulated Benefit Obligation at Dec. 31 ................................
......
$
3,475,154
$
3,073,637
Change in Projected Benefit Obligation:
Obligation at Jan. 1 ................................
..............................
$
3,226,219
$
3,030,292
Service cost ................................................................
.....
86,364
77,319
Interest cost ................................................................
.....
157,035
161,412
Plan amendments ................................
................................
6,240
-
Actuarial loss ................................................................
...
400,429
195,369
Benefit payments ................................
................................
(236,757)
(238,173
)
Obligation at Dec. 31 ................................
............................
$
3,639,530
$
3,226,219
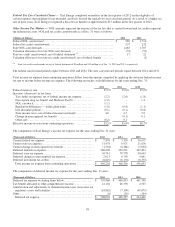
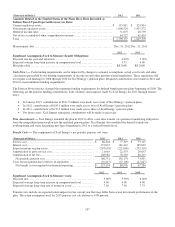
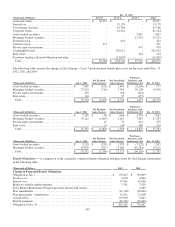
(Thousands of Dollars)
2012
2011
Change in Fair Value of Plan Assets:
Fair value of plan assets at Jan. 1................................
..................
$
2,670,280
$
2,540,708
Actual return on plan assets ................................
......................
312,167
230,401
Employer contributions ................................
..........................
198,093
137,344
Benefit payments ................................
................................
(236,757)
(238,173
)
Fair value of plan assets at Dec. 31 ................................
................
$
2,943,783
$
2,670,280
Funded Status of Plans at Dec. 31:
Funded status (a) ................................................................
.
$
(695,747)
$
(555,939
)
(a) Amounts are recognized in noncurrent liabilities on Xcel Energy’s consolidated balance sheets.
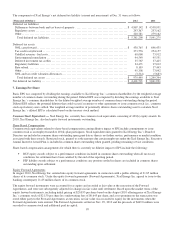
(Thousands of Dollars)
2012
2011
Amounts Not Yet Recognized as Components of Net Periodic Benefit Cost:
Net loss................................................................
.........
$
1,800,770
$
1,610,946
Prior service (credit) cost................................
.........................
(2,633)
18,432
Total ................................................................
...........
$
1,798,137
$
1,629,378