Xcel Energy 2012 Annual Report Download - page 169
Download and view the complete annual report
Please find page 169 of the 2012 Xcel Energy annual report below. You can navigate through the pages in the report by either clicking on the pages listed below, or by using the keyword search tool below to find specific information within the annual report.-
 1
1 -
2
-
3
-
4
-
5
-
6
-
7
-
8
-
9
-
10
-
11
-
12
-
13
-
14
-
15
-
16
-
17
-
18
-
19
-
20
-
21
-
22
-
23
-
24
-
25
-
26
-
27
-
28
-
29
-
30
-
31
-
32
-
33
-
34
-
35
-
36
-
37
-
38
-
39
-
40
-
41
-
42
-
43
-
44
-
45
-
46
-
47
-
48
-
49
-
50
-
51
-
52
-
53
-
54
-
55
-
56
-
57
-
58
-
59
-
60
-
61
-
62
-
63
-
64
-
65
-
66
-
67
-
68
-
69
-
70
-
71
-
72
-
73
-
74
-
75
-
76
-
77
-
78
-
79
-
80
-
81
-
82
-
83
-
84
-
85
-
86
-
87
-
88
-
89
-
90
-
91
-
92
-
93
-
94
-
95
-
96
-
97
-
98
-
99
-
100
-
101
-
102
-
103
-
104
-
105
-
106
-
107
-
108
-
109
-
110
-
111
-
112
-
113
-
114
-
115
-
116
-
117
-
118
-
119
-
120
-
121
-
122
-
123
-
124
-
125
-
126
-
127
-
128
-
129
-
130
-
131
-
132
-
133
-
134
-
135
-
136
-
137
-
138
-
139
-
140
-
141
-
142
-
143
-
144
-
145
-
146
-
147
-
148
-
149
-
150
-
151
-
152
-
153
-
154
-
155
-
156
-
157
-
158
-
 159
159 -
 160
160 -
 161
161 -
 162
162 -
 163
163 -
 164
164 -
 165
165 -
 166
166 -
 167
167 -
 168
168 -
 169
169 -
 170
170 -
 171
171 -
 172
172
 |
 |

159
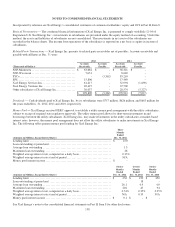
SCHEDULE II
XCEL ENERGY INC. AND SUBSIDIARIES
VALUATION AND QUALIFYING ACCOUNTS
YEARS ENDED DEC. 31, 2012, 2011 AND 2010
(amounts in thousands)
Additions
Balance at
Jan. 1
Charged to
Costs and
Expenses
Charged to
Other
Accounts (a)
Deductions
from
Reserves (b) (c)
Balance at
Dec. 31
Allowance for bad debts:
2012........................................... $
58,565
$
33,808
$
16,033
$
57,012
$
51,394
2011...........................................
54,563
44,521
15,636
56,155
58,565
2010...........................................
56,103
44,068
15,202
60,810
54,563
NOL and tax credit valuation allowances:
2012........................................... $
5,683
$
32
$
-
$
2,401
$
3,314
2011...........................................
1,927
4,379
-
623
5,683
2010...........................................
9,324
240
-
7,637
1,927
(a) Recovery of amounts previously written off as related to allowance for bad debts.
(b) Principally bad debts written off as related to allowance for bad debts.
(c) Reductions to valuation allowances for NOL and tax credit carryforwards primarily due to changes in tax laws, expirations of certain carryforwards and
identification of various tax planning strategies.