Xcel Energy 2012 Annual Report Download - page 115
Download and view the complete annual report
Please find page 115 of the 2012 Xcel Energy annual report below. You can navigate through the pages in the report by either clicking on the pages listed below, or by using the keyword search tool below to find specific information within the annual report.-
 1
1 -
2
-
3
-
4
-
5
-
6
-
7
-
8
-
9
-
10
-
11
-
12
-
13
-
14
-
15
-
16
-
17
-
18
-
19
-
20
-
21
-
22
-
23
-
24
-
25
-
26
-
27
-
28
-
29
-
30
-
31
-
32
-
33
-
34
-
35
-
36
-
37
-
38
-
39
-
40
-
41
-
42
-
43
-
44
-
45
-
46
-
47
-
48
-
49
-
50
-
51
-
52
-
53
-
54
-
55
-
56
-
57
-
58
-
59
-
60
-
61
-
62
-
63
-
64
-
65
-
66
-
67
-
68
-
69
-
70
-
71
-
72
-
73
-
74
-
75
-
76
-
77
-
78
-
79
-
80
-
81
-
82
-
83
-
84
-
85
-
86
-
87
-
88
-
89
-
90
-
91
-
92
-
93
-
94
-
95
-
96
-
97
-
98
-
99
-
100
-
101
-
102
-
103
-
104
-
 105
105 -
 106
106 -
 107
107 -
 108
108 -
 109
109 -
 110
110 -
 111
111 -
 112
112 -
 113
113 -
 114
114 -
 115
115 -
 116
116 -
 117
117 -
 118
118 -
 119
119 -
 120
120 -
 121
121 -
 122
122 -
 123
123 -
 124
124 -
 125
125 -
126
-
127
-
128
-
129
-
130
-
131
-
132
-
133
-
134
-
135
-
136
-
137
-
138
-
139
-
140
-
141
-
142
-
143
-
144
-
145
-
146
-
147
-
148
-
149
-
150
-
151
-
152
-
153
-
154
-
155
-
156
-
157
-
158
-
159
-
160
-
161
-
162
-
163
-
164
-
165
-
166
-
167
-
168
-
169
-
170
-
171
-
172
 |
 |

105
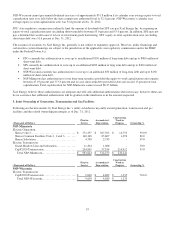
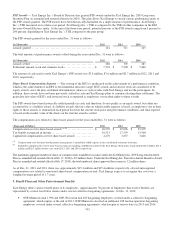
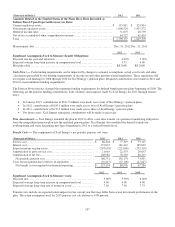
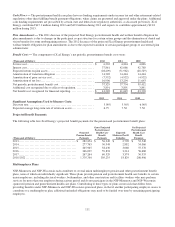
Xcel Energy’s ongoing investment strategy is based on plan-specific investment recommendations that seek to minimize potential
investment and interest rate risk as a plan’s funded status increases over time. The investment recommendations result in a greater
percentage of long-duration fixed income securities being allocated to specific plans having relatively higher funded status ratios,
and a greater percentage of growth assets being allocated to plans having relatively lower funded status ratios. The aggregate
projected asset allocation presented in the table above for the master pension trust results from the plan-specific strategies.
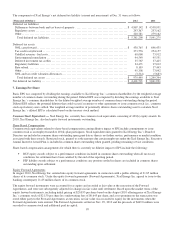
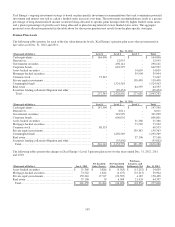
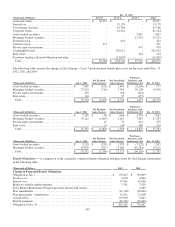
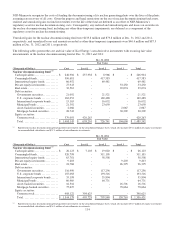
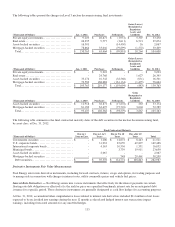
Pension Plan Assets
The following tables present, for each of the fair value hierarchy levels, Xcel Energy’s pension plan assets that are measured at
fair value as of Dec. 31, 2012 and 2011:
Dec. 31, 2012
(Thousands of Dollars)
Level 1
Level 2
Level 3
Total
Cash equivalents ................................
...............
$
164,096
$
-
$
-
$
164,096
Derivatives................................
.....................
-
12,955
-
12,955
Government securities ................................
..........
-
298,141
-
298,141
Corporate bonds ................................
................
-
622,597
-
622,597
Asset-backed securities ................................
.........
-
-
14,639
14,639
Mortgage-backed securities................................
......
-
-
39,904
39,904
Common stock ................................
.................
73,247
-
-
73,247
Private equity investments................................
.......
-
-
158,498
158,498
Commingled funds ................................
.............
-
1,524,563
-
1,524,563
Real estate ................................
.....................
-
-
64,597
64,597
Securities lending collateral obligation and other
..................
-
(29,454
)
-
(29,454)
Total ................................
........................
$
237,343
$
2,428,802
$
277,638
$
2,943,783
Dec. 31, 2011
(Thousands of Dollars)
Level 1
Level 2
Level 3
Total
Cash equivalents ................................
...............
$
147,590
$
-
$
-
$
147,590
Derivatives................................
.....................
-
8,011
-
8,011
Government securities ................................
..........
-
301,999
-
301,999
Corporate bonds ................................
................
-
606,001
-
606,001
Asset-backed securities ................................
.........
-
-
31,368
31,368
Mortgage-backed securities................................
......
-
-
73,522
73,522
Common stock ................................
.................
68,553
-
-
68,553
Private equity investments................................
.......
-
-
159,363
159,363
Commingled funds ................................
.............
-
1,292,569
-
1,292,569
Real estate ................................
.....................
-
-
37,106
37,106
Securities lending collateral obligation and other
..................
-
(55,802
)
-
(55,802)
Total................................
.........................
$
216,143
$
2,152,778
$
301,359
$
2,670,280
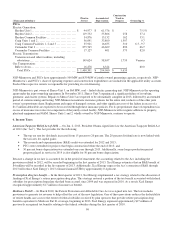
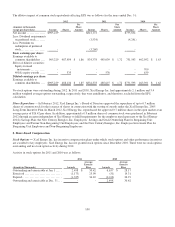
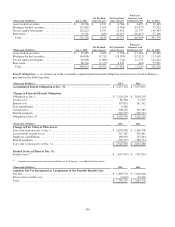
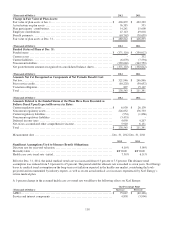
The following tables present the changes in Xcel Energy’s Level 3 pension plan assets for the years ended Dec. 31, 2012, 2011
and 2010:
Purchases,
Net Realized
Net Unrealized
Issuances, and
(Thousands of Dollars)
Jan. 1, 2012
Gains (Losses)
Gains (Losses)
Settlements, Net
Dec. 31, 2012
Asset-backed securities
..........................
$ 31,368
$ 3,886
$
(5,363
)
$
(15,252
)
$
14,639
Mortgage-backed securities
.......................
73,522
1,822
(2,127
)
(33,313
)
39,904
Private equity investments
........................
159,363
17,537
(22,587
)
4,185
158,498
Real estate ................................
......
37,106
19
6,048
21,424
64,597
Total................................
..........
$ 301,359
$ 23,264
$
(24,029
)
$
(22,956
)
$
277,638