Xcel Energy 2012 Annual Report Download - page 68
Download and view the complete annual report
Please find page 68 of the 2012 Xcel Energy annual report below. You can navigate through the pages in the report by either clicking on the pages listed below, or by using the keyword search tool below to find specific information within the annual report.-
 1
1 -
2
-
3
-
4
-
5
-
6
-
7
-
8
-
9
-
10
-
11
-
12
-
13
-
14
-
15
-
16
-
17
-
18
-
19
-
20
-
21
-
22
-
23
-
24
-
25
-
26
-
27
-
28
-
29
-
30
-
31
-
32
-
33
-
34
-
35
-
36
-
37
-
38
-
39
-
40
-
41
-
42
-
43
-
44
-
45
-
46
-
47
-
48
-
49
-
50
-
51
-
52
-
53
-
54
-
55
-
56
-
57
-
 58
58 -
 59
59 -
 60
60 -
 61
61 -
 62
62 -
 63
63 -
 64
64 -
 65
65 -
 66
66 -
 67
67 -
 68
68 -
 69
69 -
 70
70 -
 71
71 -
 72
72 -
 73
73 -
 74
74 -
 75
75 -
 76
76 -
 77
77 -
 78
78 -
79
-
80
-
81
-
82
-
83
-
84
-
85
-
86
-
87
-
88
-
89
-
90
-
91
-
92
-
93
-
94
-
95
-
96
-
97
-
98
-
99
-
100
-
101
-
102
-
103
-
104
-
105
-
106
-
107
-
108
-
109
-
110
-
111
-
112
-
113
-
114
-
115
-
116
-
117
-
118
-
119
-
120
-
121
-
122
-
123
-
124
-
125
-
126
-
127
-
128
-
129
-
130
-
131
-
132
-
133
-
134
-
135
-
136
-
137
-
138
-
139
-
140
-
141
-
142
-
143
-
144
-
145
-
146
-
147
-
148
-
149
-
150
-
151
-
152
-
153
-
154
-
155
-
156
-
157
-
158
-
159
-
160
-
161
-
162
-
163
-
164
-
165
-
166
-
167
-
168
-
169
-
170
-
171
-
172
 |
 |

58
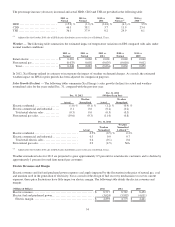
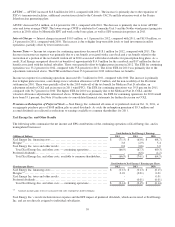
2012 Comparison to 2011 — The increase in O&M expenses for 2012 was largely driven by the following:
• Higher employee benefits are mainly due to increased pension expenses.
• Higher pipeline system integrity costs relate to increased compliance and inspection initiatives, which in Colorado are
recovered through the pipeline system integrity rider.
• See Item I – Business and Note 12 to the consolidated financial statements for further discussion of SmartGridCity and
Prairie Island EPU.
• Lower plant generation costs are primarily attributable to fewer plant overhauls in 2012.
• Higher fourth quarter labor and contract labor costs are largely driven by vegetation management and substation
maintenance.
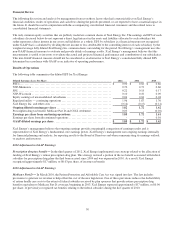
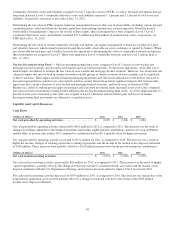
(Millions of Dollars)
2011 vs. 2010
Higher plant generation costs ................................................................
...
$
22
Higher labor and contract labor costs ................................
............................
18
Higher employee benefit expense ................................
...............................
13
Higher nuclear plant operation costs................................
.............................
12
Higher insurance costs
4
Other, net ................................................................
.....................
14
Total increase in O&M expenses................................
..............................
$
83
2011 Comparison to 2010 — The increase in O&M expenses for 2011 was largely driven by the following:
• Higher plant generation costs are attributable to incremental costs associated with new generation placed in service and a
higher level of scheduled maintenance and overhaul work.
• Higher labor and contract labor costs are primarily due to maintenance on our distribution facilities and the impact of
annual wage increases.
• Higher employee benefit costs are largely driven by higher pension expense.
• Higher nuclear plant operation costs were largely driven by outages.
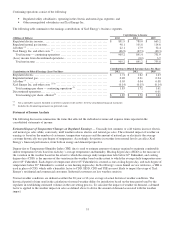
Conservation and DSM Program Expenses — Conservation and DSM program expenses decreased $20.9 million, or 7.4
percent, for 2012, compared with 2011. The lower expenses are primarily attributable to lower gas rider rates, as well as the
timing of recovery of electric CIP expenses at NSP-Minnesota. Conservation and DSM program expenses are generally recovered
in our major jurisdictions concurrently through riders and base rates. Overall, the programs are designed to encourage the
operating companies and their retail customers to conserve energy or change energy usage patterns in order to reduce peak
demand on the gas or electric system. This, in turn, reduces the need for additional plant capacity, reduces emissions, serves to
achieve other environmental goals as well as reduces energy costs to participating customers.
Conservation and DSM program expenses increased $41.6 million, or 17.3 percent for 2011, compared with 2010. The higher
expense is primarily attributable to an increase in the rider rates used to recover the program expenses.
Depreciation and Amortization — Depreciation and amortization increased $35.4 million, or 4.0 percent, for 2012, compared
with 2011. The increase is primarily due to a portion of the Monticello EPU going into service in May 2011 at NSP-Minnesota,
the Jones Unit 3 going into service in June 2011 at SPS and normal system expansion across Xcel Energy’s service territories.
Depreciation and amortization expense increased $31.7 million, or 3.7 percent for 2011, compared with 2010. This increase in
depreciation expense is primarily due to several capital projects going into service, including a portion of the Monticello EPU
going into service in May 2011, the Nobles wind project commencing commercial operations in late 2010, the acquisition of two
PSCo gas generation facilities in December 2010, Jones Unit 3 going into service in June 2011 and normal system expansion. The
increase was partially offset due to NSP-Minnesota reducing depreciation expense by approximately $30 million in the fourth
quarter of 2011 to reflect the proposed settlement in the Minnesota electric rate case.
Taxes (Other Than Income Taxes) — Taxes (other than income taxes) increased $34.1 million, or 9.1 percent, for 2012, compared
with 2011. The increases are due to an increase in property taxes primarily in Minnesota. Higher property taxes in Colorado related
to the electric retail business are being deferred, based on the multi-year rate settlement approved by the CPUC in May 2012.
Taxes (other than income taxes) increased $42.9 million, or 12.9 percent for 2011, compared with 2010. The change is primarily
due to an increase in 2011 for property taxes of approximately $29.6 million in Colorado and $8.8 million in Minnesota.
Other Income, Net — Other income, net decreased $21.9 million for 2011, compared with 2010, primarily due to the COLI
settlement in July 2010.