Xcel Energy 2012 Annual Report Download - page 90
Download and view the complete annual report
Please find page 90 of the 2012 Xcel Energy annual report below. You can navigate through the pages in the report by either clicking on the pages listed below, or by using the keyword search tool below to find specific information within the annual report.-
 1
1 -
2
-
3
-
4
-
5
-
6
-
7
-
8
-
9
-
10
-
11
-
12
-
13
-
14
-
15
-
16
-
17
-
18
-
19
-
20
-
21
-
22
-
23
-
24
-
25
-
26
-
27
-
28
-
29
-
30
-
31
-
32
-
33
-
34
-
35
-
36
-
37
-
38
-
39
-
40
-
41
-
42
-
43
-
44
-
45
-
46
-
47
-
48
-
49
-
50
-
51
-
52
-
53
-
54
-
55
-
56
-
57
-
58
-
59
-
60
-
61
-
62
-
63
-
64
-
65
-
66
-
67
-
68
-
69
-
70
-
71
-
72
-
73
-
74
-
75
-
76
-
77
-
78
-
79
-
 80
80 -
 81
81 -
 82
82 -
 83
83 -
 84
84 -
 85
85 -
 86
86 -
 87
87 -
 88
88 -
 89
89 -
 90
90 -
 91
91 -
 92
92 -
 93
93 -
 94
94 -
 95
95 -
 96
96 -
 97
97 -
 98
98 -
 99
99 -
 100
100 -
101
-
102
-
103
-
104
-
105
-
106
-
107
-
108
-
109
-
110
-
111
-
112
-
113
-
114
-
115
-
116
-
117
-
118
-
119
-
120
-
121
-
122
-
123
-
124
-
125
-
126
-
127
-
128
-
129
-
130
-
131
-
132
-
133
-
134
-
135
-
136
-
137
-
138
-
139
-
140
-
141
-
142
-
143
-
144
-
145
-
146
-
147
-
148
-
149
-
150
-
151
-
152
-
153
-
154
-
155
-
156
-
157
-
158
-
159
-
160
-
161
-
162
-
163
-
164
-
165
-
166
-
167
-
168
-
169
-
170
-
171
-
172
 |
 |

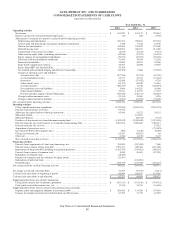
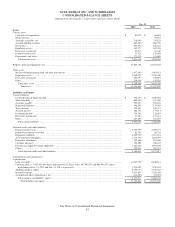
XCEL ENERGY INC. AND SUBSIDIARIES
CONSOLIDATED STATEMENTS OF CASH FLOWS
(amounts in thousands)
See Notes to Consolidated Financial Statements
80
Year Ended Dec. 31
2012
2011
2010
Operating activities
Net income.................................................................. $
905,229
$
841,172
$
755,834
Remove (income) loss from discontinued operations ...................................
(30
)
202
(3,878)
Adjustments to reconcile net income to cash provided by operating activities:
Depreciation and amortization .................................................
943,702
908,853
872,186
Conservation and demand side management program amortization .......................
7,258
9,816
21,700
Nuclear fuel amortization .....................................................
102,651
100,902
105,369
Deferred income taxes .......................................................
508,094
466,567
414,460
Amortization of investment tax credits ...........................................
(6,610
)
(6,194)
(6,353)
Allowance for equity funds used during construction .................................
(62,840
)
(51,223)
(56,152)
Equity earnings of unconsolidated subsidiaries .....................................
(29,971
)
(30,527)
(29,948)
Dividends from unconsolidated subsidiaries .......................................
33,470
34,034
32,538
Provision for bad debts .......................................................
33,808
44,521
44,068
Share-based compensation expense ..............................................
26,970
45,006
35,807
Prairie Island EPU and SmartGridCity............................................
20,766
-
-
Net realized and unrealized hedging and derivative transactions .........................
(85,308
)
9,966
(35,552)
Changes in operating assets and liabilities:
Accounts receivable .......................................................
(197,236
)
(79,701)
(29,749)
Accrued unbilled revenues ..................................................
25,377
19,951
(14,642)
Inventories..............................................................
82,658
(57,432)
9,239
Other current assets .......................................................
(30,707
)
62,458
10,461
Accounts payable.........................................................
(100,327
)
13,748
(188,855)
Net regulatory assets and liabilities ............................................
5,866
149,282
36,096
Other current liabilities.....................................................
42,914
112,353
13,192
Pension and other employee benefit obligations...................................
(183,922
)
(150,717)
(62,625)
Change in other noncurrent assets ...............................................
(33,151
)
24,069
5,936
Change in other noncurrent liabilities ............................................
(3,905
)
(61,584)
(35,190)
Net cash provided by operating activities ..............................................
2,004,756
2,405,522
1,893,942
Investing activities
Utility capital/construction expenditures ............................................
(2,570,209
)
(2,205,567)
(2,216,193)
Proceeds from insurance recoveries ................................................
97,835
-
-
Allowance for equity funds used during construction ...................................
62,840
51,223
56,152
Merricourt refund .............................................................
-
101,261
-
Merricourt deposit ............................................................
-
(90,833)
(1,134)
Purchases of investments in external decommissioning fund..............................
(1,102,025
)
(2,098,642)
(3,781,438)
Proceeds from the sale of investments in external decommissioning fund ....................
1,087,076
2,098,642
3,786,373
Proceeds from the sale of assets ..................................................
-
-
87,823
Acquisition of generation assets ..................................................
-
-
(732,495)
Investment in WYCO Development LLC ...........................................
(980
)
(2,446)
(8,046)
Change in restricted cash .......................................................
95,287
(95,287)
89
Other, net...................................................................
(2,766
)
(6,152)
2,145
Net cash used in investing activities................................................
(2,332,942
)
(2,247,801)
(2,806,724)
Financing activities
Proceeds from (repayments of) short-term borrowings, net ...............................
383,000
(247,400)
7,400
Proceeds from issuance of long-term debt ...........................................
1,790,131
688,598
1,433,406
Repayments of long-term debt, including reacquisition premiums..........................
(1,302,763
)
(105,623)
(560,383)
Proceeds from issuance of common stock ...........................................
8,050
38,691
457,258
Repurchase of common stock ....................................................
(18,529
)
-
-
Purchase of common stock for settlement of equity awards...............................
(23,307
)
-
-
Redemption of preferred stock ...................................................
-
(104,980)
-
Dividends paid ...............................................................
(486,757
)
(474,760)
(432,110)
Net cash provided by (used in) financing activities .......................................
349,825
(205,474)
905,571
Net change in cash and cash equivalents ..............................................
21,639
(47,753)
(7,211)
Cash and cash equivalents at beginning of period ........................................
60,684
108,437
115,648
Cash and cash equivalents at end of period.............................................
$
82,323
$
60,684
$
108,437
Supplemental disclosure of cash flow information:
Cash paid for interest (net of amounts capitalized) .................................... $
(563,517
)
$
(531,148)
$
(530,072)
Cash (paid) received for income taxes, net...........................................
(9,570
)
55,764
(16,635)
Supplemental disclosure of non-cash investing and financing transactions:
Property, plant and equipment additions in accounts payable ............................. $
289,802
$
137,558
$
174,903
Issuance of common stock for reinvested dividends and 401(k) plans .......................
67,723
71,715
63,905