Xcel Energy 2012 Annual Report Download - page 126
Download and view the complete annual report
Please find page 126 of the 2012 Xcel Energy annual report below. You can navigate through the pages in the report by either clicking on the pages listed below, or by using the keyword search tool below to find specific information within the annual report.-
 1
1 -
2
-
3
-
4
-
5
-
6
-
7
-
8
-
9
-
10
-
11
-
12
-
13
-
14
-
15
-
16
-
17
-
18
-
19
-
20
-
21
-
22
-
23
-
24
-
25
-
26
-
27
-
28
-
29
-
30
-
31
-
32
-
33
-
34
-
35
-
36
-
37
-
38
-
39
-
40
-
41
-
42
-
43
-
44
-
45
-
46
-
47
-
48
-
49
-
50
-
51
-
52
-
53
-
54
-
55
-
56
-
57
-
58
-
59
-
60
-
61
-
62
-
63
-
64
-
65
-
66
-
67
-
68
-
69
-
70
-
71
-
72
-
73
-
74
-
75
-
76
-
77
-
78
-
79
-
80
-
81
-
82
-
83
-
84
-
85
-
86
-
87
-
88
-
89
-
90
-
91
-
92
-
93
-
94
-
95
-
96
-
97
-
98
-
99
-
100
-
101
-
102
-
103
-
104
-
105
-
106
-
107
-
108
-
109
-
110
-
111
-
112
-
113
-
114
-
115
-
 116
116 -
 117
117 -
 118
118 -
 119
119 -
 120
120 -
 121
121 -
 122
122 -
 123
123 -
 124
124 -
 125
125 -
 126
126 -
 127
127 -
 128
128 -
 129
129 -
 130
130 -
 131
131 -
 132
132 -
 133
133 -
 134
134 -
 135
135 -
 136
136 -
137
-
138
-
139
-
140
-
141
-
142
-
143
-
144
-
145
-
146
-
147
-
148
-
149
-
150
-
151
-
152
-
153
-
154
-
155
-
156
-
157
-
158
-
159
-
160
-
161
-
162
-
163
-
164
-
165
-
166
-
167
-
168
-
169
-
170
-
171
-
172
 |
 |

116
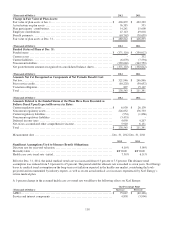
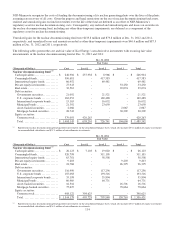
In conjunction with the NSP-Minnesota debt issuance in August 2012, NSP-Minnesota settled interest rate hedging instruments
with a notional amount of $225 million with cash payments of $45.0 million. In conjunction with the PSCo debt issuance in
September 2012, PSCo settled interest rate hedging instruments with a notional amount of $250 million with cash payments of
$44.7 million. These losses are classified as a component of accumulated other comprehensive loss on the consolidated balance
sheet, net of tax, and are being reclassified to earnings over the term of the hedged interest payments. See Note 4 for further
discussion of long-term borrowings.
Wholesale and Commodity Trading Risk — Xcel Energy Inc.’s utility subsidiaries conduct various wholesale and commodity
trading activities, including the purchase and sale of electric capacity, energy and energy-related instruments. Xcel Energy’s risk
management policy allows management to conduct these activities within guidelines and limitations as approved by its risk
management committee, which is made up of management personnel not directly involved in the activities governed by this policy.
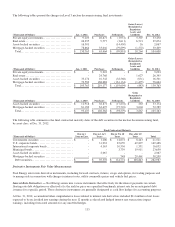
Commodity Derivatives — Xcel Energy enters into derivative instruments to manage variability of future cash flows from changes in
commodity prices in its electric and natural gas operations, as well as for trading purposes. This could include the purchase or sale of
energy or energy-related products, natural gas to generate electric energy, natural gas for resale and vehicle fuel.
At Dec. 31, 2012, Xcel Energy had various vehicle fuel related contracts designated as cash flow hedges extending through
December 2016. Xcel Energy also enters into derivative instruments that mitigate commodity price risk on behalf of electric and
natural gas customers but are not designated as qualifying hedging transactions. Changes in the fair value of non-trading
commodity derivative instruments are recorded in OCI or deferred as a regulatory asset or liability. The classification as a
regulatory asset or liability is based on commission approved regulatory recovery mechanisms. Xcel Energy recorded immaterial
amounts to income related to the ineffectiveness of cash flow hedges for the years ended Dec. 31, 2012 and 2011.
At Dec. 31, 2012, net gains related to commodity derivative cash flow hedges recorded as a component of accumulated other
comprehensive losses included $0.1 million of net gains expected to be reclassified into earnings during the next 12 months as the
hedged transactions occur.
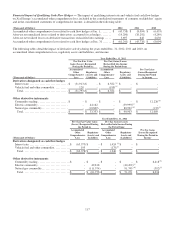
Additionally, Xcel Energy enters into commodity derivative instruments for trading purposes not directly related to commodity
price risks associated with serving its electric and natural gas customers. Changes in the fair value of these commodity derivatives
are recorded in electric operating revenues, net of amounts credited to customers under margin-sharing mechanisms.
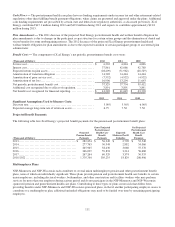
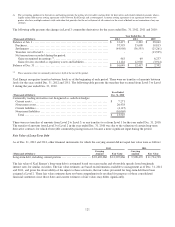
The following table details the gross notional amounts of commodity forwards, options and FTRs at Dec. 31, 2012 and 2011:
(Amounts in Thousands) (a)(b)
Dec. 31, 2012
Dec. 31, 2011
MWh of electricity ................................
..................
55,976
38,822
MMBtu of natural gas................................
................
725
40,736
Gallons of vehicle fuel ................................
...............
682
600
(a) Amounts are not reflective of net positions in the underlying commodities.
(b) Notional amounts for options are included on a gross basis, but are weighted for the probability of exercise.
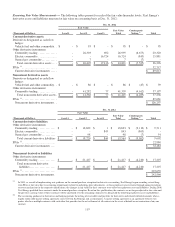
Consideration of Credit Risk and Concentrations — Xcel Energy continuously monitors the creditworthiness of the
counterparties to its interest rate derivatives and commodity derivative contracts prior to settlement, and assesses each
counterparty’s ability to perform on the transactions set forth in the contracts. Given this assessment, as well as an assessment of
the impact of Xcel Energy’s own credit risk when determining the fair value of derivative liabilities, the impact of considering
credit risk was immaterial to the fair value of unsettled commodity derivatives presented in the consolidated balance sheets.
Xcel Energy Inc. and its subsidiaries employ additional credit risk control mechanisms when appropriate, such as letters of credit,
parental guarantees, standardized master netting agreements and termination provisions that allow for offsetting of positive and
negative exposures. Credit exposure is monitored and, when necessary, the activity with a specific counterparty is limited until
credit enhancement is provided.
Xcel Energy’s utility subsidiaries’ most significant concentrations of credit risk with particular entities or industries are contracts
with counterparties to their wholesale, trading and non-trading commodity activities. At Dec. 31, 2012, five of Xcel Energy’s 10
most significant counterparties for these activities, comprising $67.1 million or 23 percent of this credit exposure at Dec. 31,
2012, had investment grade credit ratings from Standard & Poor’s, Moody’s or Fitch Ratings. The remaining five significant
counterparties, comprising $75.3 million or 26 percent of this credit exposure at Dec. 31, 2012, were not rated by these agencies,
but based on Xcel Energy’s internal analysis, had credit quality consistent with investment grade. All 10 of these significant
counterparties are municipal or cooperative electric entities or other utilities, and no single counterparty comprised greater than 10
percent of Xcel Energy’s credit exposure at Dec. 31, 2012.