Xcel Energy 2012 Annual Report Download - page 23
Download and view the complete annual report
Please find page 23 of the 2012 Xcel Energy annual report below. You can navigate through the pages in the report by either clicking on the pages listed below, or by using the keyword search tool below to find specific information within the annual report.-
 1
1 -
2
-
3
-
4
-
5
-
6
-
7
-
8
-
9
-
10
-
11
-
12
-
 13
13 -
 14
14 -
 15
15 -
 16
16 -
 17
17 -
 18
18 -
 19
19 -
 20
20 -
 21
21 -
 22
22 -
 23
23 -
 24
24 -
 25
25 -
 26
26 -
 27
27 -
 28
28 -
 29
29 -
 30
30 -
 31
31 -
 32
32 -
 33
33 -
34
-
35
-
36
-
37
-
38
-
39
-
40
-
41
-
42
-
43
-
44
-
45
-
46
-
47
-
48
-
49
-
50
-
51
-
52
-
53
-
54
-
55
-
56
-
57
-
58
-
59
-
60
-
61
-
62
-
63
-
64
-
65
-
66
-
67
-
68
-
69
-
70
-
71
-
72
-
73
-
74
-
75
-
76
-
77
-
78
-
79
-
80
-
81
-
82
-
83
-
84
-
85
-
86
-
87
-
88
-
89
-
90
-
91
-
92
-
93
-
94
-
95
-
96
-
97
-
98
-
99
-
100
-
101
-
102
-
103
-
104
-
105
-
106
-
107
-
108
-
109
-
110
-
111
-
112
-
113
-
114
-
115
-
116
-
117
-
118
-
119
-
120
-
121
-
122
-
123
-
124
-
125
-
126
-
127
-
128
-
129
-
130
-
131
-
132
-
133
-
134
-
135
-
136
-
137
-
138
-
139
-
140
-
141
-
142
-
143
-
144
-
145
-
146
-
147
-
148
-
149
-
150
-
151
-
152
-
153
-
154
-
155
-
156
-
157
-
158
-
159
-
160
-
161
-
162
-
163
-
164
-
165
-
166
-
167
-
168
-
169
-
170
-
171
-
172
 |
 |

13
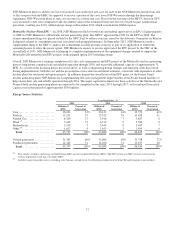
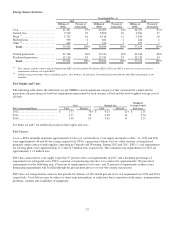
Fuel Supply and Costs
The following table shows the delivered cost per MMBtu of each significant category of fuel consumed for owned electric
generation, the percentage of total fuel requirements represented by each category of fuel and the total weighted average cost of
all fuels.
Coal*
Nuclear
Natural Gas
Weighted
Average Owned
NSP System Generating Plants
Cost
Percent
Cost
Percent
Cost
Percent
Fuel Cost
2012
...........................
$
2.13
47
%
$ 0.90
42
%
$
4.21
11%
$
1.88
2011
...........................
2.06
55
0.89
40
6.56
5
1.82
2010
...........................
1.89
51
0.83
42
6.29
7
1.73
* Includes refuse-derived fuel and wood.
See Items 1A and 7 for further discussion of fuel supply and costs.
Fuel Sources
Coal — The NSP System normally maintains approximately 41 days of coal inventory. Coal supply inventories at Dec. 31, 2012
and 2011 were approximately 39 and 48 days usage, respectively. NSP-Minnesota’s generation stations use low-sulfur western
coal purchased primarily under contracts with suppliers operating in Wyoming and Montana. During 2012 and 2011, coal
requirements for the NSP System’s major coal-fired generating plants were approximately 7.2 million tons and 9.5 million tons,
respectively. The estimated coal requirements for 2013 are approximately 8.6 million tons.
NSP-Minnesota and NSP-Wisconsin have contracted for coal supplies to provide 97 percent of their coal requirements in 2013,
and a declining percentage of the requirements in subsequent years. The NSP System’s general coal purchasing objective is to
contract for approximately 100 percent of requirements for the following year, 67 percent of requirements in two years, and 33
percent of requirements in three years. Remaining requirements will be filled through the procurement process or over-the-
counter transactions.
NSP-Minnesota and NSP-Wisconsin have a number of coal transportation contracts that provide for delivery of 100 and 80
percent of their coal requirements in 2013 and 2014, respectively. Coal delivery may be subject to short-term interruptions or
reductions due to operation of the mines, transportation problems, weather and availability of equipment.
Nuclear — To operate NSP-Minnesota’s nuclear generating plants, NSP-Minnesota secures contracts for uranium concentrates,
uranium conversion, uranium enrichment and fuel fabrication. The contract strategy involves a portfolio of spot purchases and
medium and long-term contracts for uranium concentrates, conversion services and enrichment services with multiple producers
and with a focus on diversification to minimize potential impacts caused by supply interruptions due to geographical and world
political issues.
• Current nuclear fuel supply contracts cover 100 percent of uranium concentrates requirements through 2018 and
approximately 67 percent of the requirements for 2019 through 2025.
• Current contracts for conversion services cover 100 percent of the requirements through 2020 and approximately 67
percent of the requirements for 2021 through 2025.
• Current enrichment service contracts cover 99.7 percent of the requirements through 2022 and approximately 84 percent
of the requirements for 2023 through 2025.
Fabrication services for Monticello and Prairie Island are 100 percent committed through 2025 and 2014, respectively. A contract
for fuel fabrication services for Prairie Island is currently being negotiated for 2015 and beyond.
NSP-Minnesota expects sufficient uranium concentrates, conversion services and enrichment services to be available for the total
fuel requirements of its nuclear generating plants. Some exposure to spot market price volatility will remain due to index-based
pricing structures contained in certain supply contracts.