Xcel Energy 2012 Annual Report Download - page 166
Download and view the complete annual report
Please find page 166 of the 2012 Xcel Energy annual report below. You can navigate through the pages in the report by either clicking on the pages listed below, or by using the keyword search tool below to find specific information within the annual report.-
 1
1 -
2
-
3
-
4
-
5
-
6
-
7
-
8
-
9
-
10
-
11
-
12
-
13
-
14
-
15
-
16
-
17
-
18
-
19
-
20
-
21
-
22
-
23
-
24
-
25
-
26
-
27
-
28
-
29
-
30
-
31
-
32
-
33
-
34
-
35
-
36
-
37
-
38
-
39
-
40
-
41
-
42
-
43
-
44
-
45
-
46
-
47
-
48
-
49
-
50
-
51
-
52
-
53
-
54
-
55
-
56
-
57
-
58
-
59
-
60
-
61
-
62
-
63
-
64
-
65
-
66
-
67
-
68
-
69
-
70
-
71
-
72
-
73
-
74
-
75
-
76
-
77
-
78
-
79
-
80
-
81
-
82
-
83
-
84
-
85
-
86
-
87
-
88
-
89
-
90
-
91
-
92
-
93
-
94
-
95
-
96
-
97
-
98
-
99
-
100
-
101
-
102
-
103
-
104
-
105
-
106
-
107
-
108
-
109
-
110
-
111
-
112
-
113
-
114
-
115
-
116
-
117
-
118
-
119
-
120
-
121
-
122
-
123
-
124
-
125
-
126
-
127
-
128
-
129
-
130
-
131
-
132
-
133
-
134
-
135
-
136
-
137
-
138
-
139
-
140
-
141
-
142
-
143
-
144
-
145
-
146
-
147
-
148
-
149
-
150
-
151
-
152
-
153
-
154
-
155
-
 156
156 -
 157
157 -
 158
158 -
 159
159 -
 160
160 -
 161
161 -
 162
162 -
 163
163 -
 164
164 -
 165
165 -
 166
166 -
 167
167 -
 168
168 -
 169
169 -
 170
170 -
 171
171 -
 172
172
 |
 |

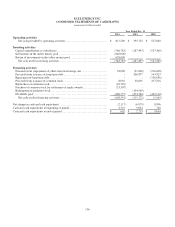
156
XCEL ENERGY INC.
CONDENSED STATEMENTS OF CASH FLOWS
(amounts in thousands)
Year Ended Dec. 31
2012
2011
2010
Operating activities
Net cash provided by operating activities .................................. $
815,209
$
595,732
$
537,840
Investing activities
Capital contributions to subsidiaries.........................................
(366,783
)
(287,495)
(523,369)
Investments in the utility money pool .......................................
(640,000
)
-
-
Return of investments in the utility money pool ..............................
658,000
-
-
Net cash used in investing activities .......................................
(348,783
)
(287,495)
(523,369)
Financing activities
Proceeds from (repayment of) short-term borrowings, net .....................
52,000
(21,000)
(216,000)
Proceeds from issuance of long-term debt ...................................
-
246,877
543,923
Repayment of long-term debt ...............................................
-
-
(358,636)
Proceeds from issuance of common stock....................................
8,050
38,691
457,258
Repurchase of common stock...............................................
(18,529
)
-
-
Purchase of common stock for settlement of equity awards....................
(23,307
)
-
-
Redemption of preferred stock..............................................
-
(104,980)
-
Dividends paid ............................................................
(486,757
)
(474,760)
(432,110)
Net cash used in financing activities.......................................
(468,543
)
(315,172)
(5,565)
Net change in cash and cash equivalents .......................................
(2,117
)
(6,935)
8,906
Cash and cash equivalents at beginning of period...............................
2,719
9,654
748
Cash and cash equivalents at end of period..................................... $
602
$
2,719
$
9,654