Xcel Energy 2012 Annual Report Download - page 113
Download and view the complete annual report
Please find page 113 of the 2012 Xcel Energy annual report below. You can navigate through the pages in the report by either clicking on the pages listed below, or by using the keyword search tool below to find specific information within the annual report.-
 1
1 -
2
-
3
-
4
-
5
-
6
-
7
-
8
-
9
-
10
-
11
-
12
-
13
-
14
-
15
-
16
-
17
-
18
-
19
-
20
-
21
-
22
-
23
-
24
-
25
-
26
-
27
-
28
-
29
-
30
-
31
-
32
-
33
-
34
-
35
-
36
-
37
-
38
-
39
-
40
-
41
-
42
-
43
-
44
-
45
-
46
-
47
-
48
-
49
-
50
-
51
-
52
-
53
-
54
-
55
-
56
-
57
-
58
-
59
-
60
-
61
-
62
-
63
-
64
-
65
-
66
-
67
-
68
-
69
-
70
-
71
-
72
-
73
-
74
-
75
-
76
-
77
-
78
-
79
-
80
-
81
-
82
-
83
-
84
-
85
-
86
-
87
-
88
-
89
-
90
-
91
-
92
-
93
-
94
-
95
-
96
-
97
-
98
-
99
-
100
-
101
-
102
-
 103
103 -
 104
104 -
 105
105 -
 106
106 -
 107
107 -
 108
108 -
 109
109 -
 110
110 -
 111
111 -
 112
112 -
 113
113 -
 114
114 -
 115
115 -
 116
116 -
 117
117 -
 118
118 -
 119
119 -
 120
120 -
 121
121 -
 122
122 -
 123
123 -
124
-
125
-
126
-
127
-
128
-
129
-
130
-
131
-
132
-
133
-
134
-
135
-
136
-
137
-
138
-
139
-
140
-
141
-
142
-
143
-
144
-
145
-
146
-
147
-
148
-
149
-
150
-
151
-
152
-
153
-
154
-
155
-
156
-
157
-
158
-
159
-
160
-
161
-
162
-
163
-
164
-
165
-
166
-
167
-
168
-
169
-
170
-
171
-
172
 |
 |

103
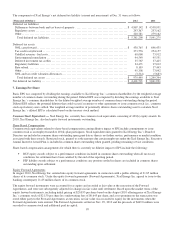
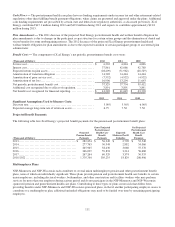
PSP Awards — Xcel Energy Inc.’s Board of Directors has granted PSP awards under the Xcel Energy Inc. 2005 Long-term
Incentive Plan (as amended and restated effective in 2010). The plan allows Xcel Energy to attach various performance goals to
the PSP awards granted. The PSP awards have been historically dependent on a single measure of performance, Xcel Energy
Inc.’s TSR measured over a three-year period. Xcel Energy Inc.’s TSR is compared to the TSR of other companies in the EEI
Investor-Owned Electrics index. At the end of the three-year period, potential payouts of the PSP awards range from 0 percent to
200 percent, depending on Xcel Energy Inc.’s TSR compared to the peer group.
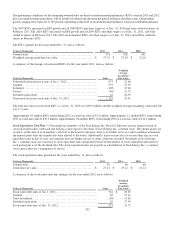
The PSP awards granted for the years ended Dec. 31 were as follows:
(In Thousands)
2012
2011
2010
Awards granted ................................
..................
161
311
225
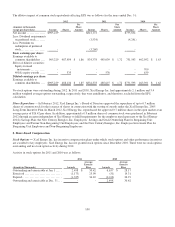
The total amounts of performance awards settled during the years ended Dec. 31 were as follows:
(In Thousands)
2012
2011
2010
Awards settled ................................
...................
286
305
267
Settlement amount (cash and common stock)
.......................
$
7,554
$
7,200
$
5,460
The amount of cash used to settle Xcel Energy’s PSP awards was $3.8 million, $3.6 million and $2.7 million in 2012, 2011 and
2010, respectively.
Share-Based Compensation Expense — The vesting of the RSUs is predicated on the achievement of a performance condition,
which is the achievement of an EPS or environmental measures target. RSU awards and restricted stock are considered to be
equity awards, since the plan settlement determination (shares or cash) resides with Xcel Energy and not the participants. In
addition, these awards have not been previously settled in cash and Xcel Energy plans to continue electing share settlement. The
grant date fair value of RSUs and restricted stock is expensed as employees vest in their rights to those awards.
The PSP awards have been historically settled partially in cash, and therefore, do not qualify as an equity award, but rather are
accounted for as a liability award. As liability awards, the fair value on which ratable expense is based, as employees vest in their
rights to those awards, is remeasured each period based on the current stock price and performance conditions, and final expense
is based on the market value of the shares on the date the award is settled.
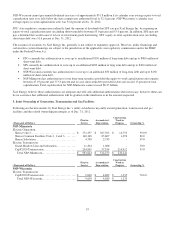
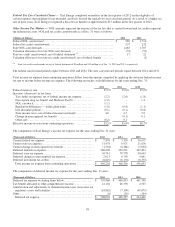
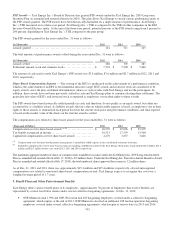
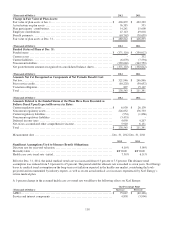
The compensation costs related to share-based awards for the years ended Dec. 31 were as follows:
(Thousands of Dollars)
2012
2011
2010
Compensation cost for share-based awards (a) (b)
.....................
$
26,970
$
45,006
$
35,807
Tax benefit recognized in income ................................
..
10,513
17,559
13,964
Capitalized compensation cost for share-based awards
...............
4,270
3,857
3,646
(a) Compensation costs for share-based payment arrangements is included in O&M expense in the consolidated statements of income.
(b) Included in compensation cost for share-based awards are matching contributions related to the Xcel Energy 401(k) plan, which totaled $22.2 million, $21.6
million and $20.7 million for the years ended 2012, 2011 and 2010, respectively.
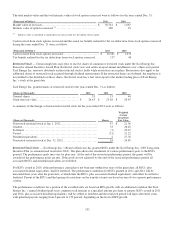
The maximum aggregate number of shares of common stock available for issuance under the Xcel Energy Inc. 2005 Long-term Incentive
Plan (as amended and restated effective Feb. 17, 2010) is 8.3 million shares. Under the Xcel Energy Inc. Executive Annual Incentive Award
Plan (as amended and restated effective Feb. 17, 2010), the total number of shares approved for issuance is 1.2 million shares.
As of Dec. 31, 2012 and 2011, there was approximately $15.3 million and $15.4 million, respectively, of total unrecognized
compensation cost related to nonvested share-based compensation awards. Xcel Energy expects to recognize that cost over a
weighted average period of 1.7 years.
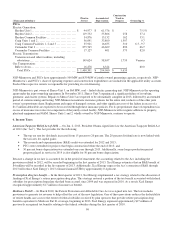
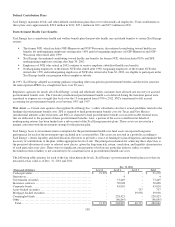
9. Benefit Plans and Other Postretirement Benefits
Xcel Energy offers various benefit plans to its employees. Approximately 50 percent of employees that receive benefits are
represented by several local labor unions under several collective-bargaining agreements. At Dec. 31, 2012:
• NSP-Minnesota had 1,996 and NSP-Wisconsin had 405 bargaining employees covered under a collective-bargaining
agreement, which expires at the end of 2013. NSP-Minnesota also had an additional 228 nuclear operation bargaining
employees covered under several collective-bargaining agreements, which expire at various dates in 2013 and 2014.