Xcel Energy 2012 Annual Report Download - page 60
Download and view the complete annual report
Please find page 60 of the 2012 Xcel Energy annual report below. You can navigate through the pages in the report by either clicking on the pages listed below, or by using the keyword search tool below to find specific information within the annual report.-
 1
1 -
2
-
3
-
4
-
5
-
6
-
7
-
8
-
9
-
10
-
11
-
12
-
13
-
14
-
15
-
16
-
17
-
18
-
19
-
20
-
21
-
22
-
23
-
24
-
25
-
26
-
27
-
28
-
29
-
30
-
31
-
32
-
33
-
34
-
35
-
36
-
37
-
38
-
39
-
40
-
41
-
42
-
43
-
44
-
45
-
46
-
47
-
48
-
49
-
 50
50 -
 51
51 -
 52
52 -
 53
53 -
 54
54 -
 55
55 -
 56
56 -
 57
57 -
 58
58 -
 59
59 -
 60
60 -
 61
61 -
 62
62 -
 63
63 -
 64
64 -
 65
65 -
 66
66 -
 67
67 -
 68
68 -
 69
69 -
 70
70 -
71
-
72
-
73
-
74
-
75
-
76
-
77
-
78
-
79
-
80
-
81
-
82
-
83
-
84
-
85
-
86
-
87
-
88
-
89
-
90
-
91
-
92
-
93
-
94
-
95
-
96
-
97
-
98
-
99
-
100
-
101
-
102
-
103
-
104
-
105
-
106
-
107
-
108
-
109
-
110
-
111
-
112
-
113
-
114
-
115
-
116
-
117
-
118
-
119
-
120
-
121
-
122
-
123
-
124
-
125
-
126
-
127
-
128
-
129
-
130
-
131
-
132
-
133
-
134
-
135
-
136
-
137
-
138
-
139
-
140
-
141
-
142
-
143
-
144
-
145
-
146
-
147
-
148
-
149
-
150
-
151
-
152
-
153
-
154
-
155
-
156
-
157
-
158
-
159
-
160
-
161
-
162
-
163
-
164
-
165
-
166
-
167
-
168
-
169
-
170
-
171
-
172
 |
 |

50
Financial Review
The following discussion and analysis by management focuses on those factors that had a material effect on Xcel Energy’s
financial condition, results of operations and cash flows during the periods presented, or are expected to have a material impact in
the future. It should be read in conjunction with the accompanying consolidated financial statements and the related notes to
consolidated financial statements.
The only common equity securities that are publicly traded are common shares of Xcel Energy Inc. The earnings and EPS of each
subsidiary discussed below do not represent a direct legal interest in the assets and liabilities allocated to such subsidiary but
rather represent a direct interest in our assets and liabilities as a whole. EPS by subsidiary is a financial measure not recognized
under GAAP that is calculated by dividing the net income or loss attributable to the controlling interest of each subsidiary by the
weighted average fully diluted Xcel Energy Inc. common shares outstanding for the period. Xcel Energy’s management uses this
non-GAAP financial measure to evaluate and provide details of earnings results. Xcel Energy’s management believes that this
measurement is useful to investors to evaluate the actual and projected financial performance and contribution of our subsidiaries.
This non-GAAP financial measure should not be considered as an alternative to Xcel Energy’s consolidated fully diluted EPS
determined in accordance with GAAP as an indicator of operating performance.
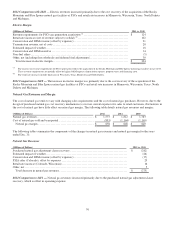
Results of Operations
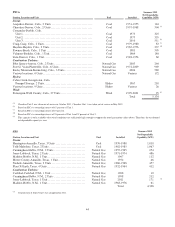
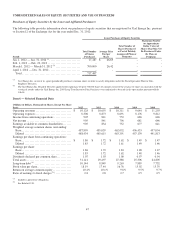
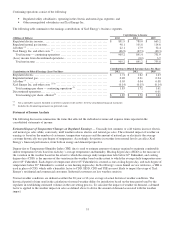
The following table summarizes the diluted EPS for Xcel Energy:
Diluted Earnings (Loss) Per Share
2012
2011
2010
PSCo ..........................................................................
$
0.90
$
0.82
$ 0.86
NSP-Minnesota ................................................................
0.70
0.73
0.60
SPS ...........................................................................
0.22
0.18
0.17
NSP-Wisconsin ................................................................
0.10
0.10
0.09
Equity earnings of unconsolidated subsidiaries ....................................
0.04
0.04
0.04
Regulated utility — continuing operations ........................................
1.96
1.87
1.76
Xcel Energy Inc. and other costs .................................................
(0.14)
(0.15)
(0.14)
Ongoing diluted earnings per share ............................................
1.82
1.72
1.62
Prescription drug tax benefit, Medicare Part D and COLI settlement ................
0.03
-
(0.01)
Earnings per share from continuing operations.................................
1.85
1.72
1.61
Earnings per share from discontinued operations ..................................
-
-
0.01
GAAP diluted earnings per share ..............................................
$
1.85
$
1.72
$ 1.62
Xcel Energy’s management believes that ongoing earnings provide a meaningful comparison of earnings results and is
representative of Xcel Energy’s fundamental core earnings power. Xcel Energy’s management uses ongoing earnings internally
for financial planning and analysis, for reporting results to the Board of Directors and when communicating its earnings outlook
to analysts and investors.
2012 Adjustment to GAAP Earnings
Prescription drug tax benefit — In the third quarter of 2012, Xcel Energy implemented a tax strategy related to the allocation of
funding of Xcel Energy’s retiree prescription drug plan. This strategy restored a portion of the tax benefit associated with federal
subsidies for prescription drug plans that had been accrued since 2004 and was expensed in 2010. As a result, Xcel Energy
recognized approximately $17 million, or $0.03 per share, of income tax benefit.
2010 Adjustment to GAAP Earnings
Medicare Part D — In March 2010, the Patient Protection and Affordable Care Act was signed into law. The law includes
provisions to generate tax revenue to help offset the cost of the new legislation. One of these provisions reduces the deductibility
of retiree health care costs to the extent of federal subsidies received by plan sponsors that provide retiree prescription drug
benefits equivalent to Medicare Part D coverage, beginning in 2013. Xcel Energy expensed approximately $17 million, or $0.04
per share, of previously recognized tax benefits relating to the federal subsidies during the first quarter of 2010.