Xcel Energy 2012 Annual Report Download - page 121
Download and view the complete annual report
Please find page 121 of the 2012 Xcel Energy annual report below. You can navigate through the pages in the report by either clicking on the pages listed below, or by using the keyword search tool below to find specific information within the annual report.-
 1
1 -
2
-
3
-
4
-
5
-
6
-
7
-
8
-
9
-
10
-
11
-
12
-
13
-
14
-
15
-
16
-
17
-
18
-
19
-
20
-
21
-
22
-
23
-
24
-
25
-
26
-
27
-
28
-
29
-
30
-
31
-
32
-
33
-
34
-
35
-
36
-
37
-
38
-
39
-
40
-
41
-
42
-
43
-
44
-
45
-
46
-
47
-
48
-
49
-
50
-
51
-
52
-
53
-
54
-
55
-
56
-
57
-
58
-
59
-
60
-
61
-
62
-
63
-
64
-
65
-
66
-
67
-
68
-
69
-
70
-
71
-
72
-
73
-
74
-
75
-
76
-
77
-
78
-
79
-
80
-
81
-
82
-
83
-
84
-
85
-
86
-
87
-
88
-
89
-
90
-
91
-
92
-
93
-
94
-
95
-
96
-
97
-
98
-
99
-
100
-
101
-
102
-
103
-
104
-
105
-
106
-
107
-
108
-
109
-
110
-
 111
111 -
 112
112 -
 113
113 -
 114
114 -
 115
115 -
 116
116 -
 117
117 -
 118
118 -
 119
119 -
 120
120 -
 121
121 -
 122
122 -
 123
123 -
 124
124 -
 125
125 -
 126
126 -
 127
127 -
 128
128 -
 129
129 -
 130
130 -
 131
131 -
132
-
133
-
134
-
135
-
136
-
137
-
138
-
139
-
140
-
141
-
142
-
143
-
144
-
145
-
146
-
147
-
148
-
149
-
150
-
151
-
152
-
153
-
154
-
155
-
156
-
157
-
158
-
159
-
160
-
161
-
162
-
163
-
164
-
165
-
166
-
167
-
168
-
169
-
170
-
171
-
172
 |
 |

111
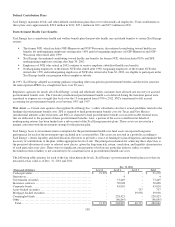
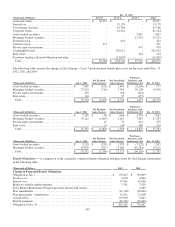
Cash Flows — The postretirement health care plans have no funding requirements under income tax and other retirement-related
regulations other than fulfilling benefit payment obligations, when claims are presented and approved under the plans. Additional
cash funding requirements are prescribed by certain state and federal rate regulatory authorities, as discussed previously. Xcel
Energy contributed $47.1 million during 2012 and $49.0 million during 2011 and expects to contribute approximately $21.8
million during 2013.
Plan Amendments — The 2011 decrease of the projected Xcel Energy postretirement health and welfare benefit obligation for
plan amendments is due to changes in the participant co-pay structure for certain retiree groups and the elimination of dental and
vision benefits for some nonbargaining retirees. The 2012 decrease of the projected Xcel Energy postretirement health and
welfare benefit obligation for plan amendments is due to the expected transition of certain participant groups to an external plan
administrator.
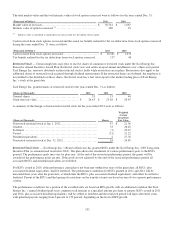
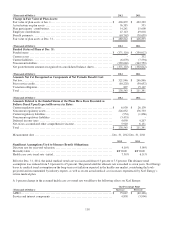
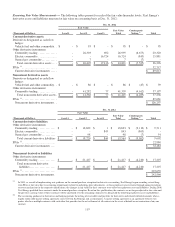
Benefit Costs — The components of Xcel Energy’s net periodic postretirement benefit costs were:
(Thousands of Dollars)
2012
2011
2010
Service cost ................................
......................
$
4,203
$
4,824
$
4,006
Interest cost ................................
......................
37,861
42,086
42,780
Expected return on plan assets ................................
.....
(28,409
)
(31,962
)
(28,529
)
Amortization of transition obligation
...............................
14,320
14,444
14,444
Amortization of prior service cost ................................
..
(7,552
)
(4,932
)
(4,932
)
Amortization of net loss................................
...........
16,906
13,294
11,643
Net periodic postretirement benefit cost
............................
37,329
37,754
39,412
Additional cost recognized due to effects of regulation
...............
3,891
3,891
3,891
Net benefit cost recognized for financial reporting
...................
$
41,220
$
41,645
$
43,303
2012
2011
2010
Significant Assumptions Used to Measure Costs:
Discount rate ................................
.....................
5.00
%
5.50
%
6.00
%
Expected average long-term rate of return on assets
..................
6.75
7.50
7.50
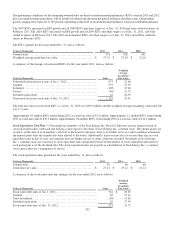
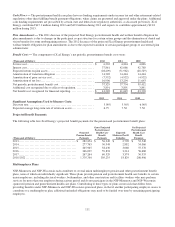
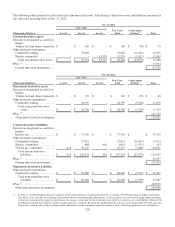
Projected Benefit Payments
The following table lists Xcel Energy’s projected benefit payments for the pension and postretirement benefit plans:
(Thousands of Dollars)
Projected
Pension Benefit
Payments
Gross Projected
Postretirement
Health Care
Benefit
Payments
Expected
Medicare Part D
Subsidies
Net Projected
Postretirement
Health Care
Benefit
Payments
2013................................
...............
$
282,854
$
56,249
$
2,709
$ 53,540
2014................................
...............
277,763
56,948
2,882
54,066
2015................................
...............
265,965
58,430
3,060
55,370
2016................................
...............
266,039
59,894
3,214
56,680
2017................................
...............
267,264
60,329
3,374
56,955
2018-2022 ................................
.........
1,335,384
305,235
18,829
286,406
Multiemployer Plans
NSP-Minnesota and NSP-Wisconsin each contribute to several union multiemployer pension and other postretirement benefit
plans, none of which are individually significant. These plans provide pension and postretirement health care benefits to certain
union employees, including electrical workers, boilermakers, and other construction and facilities workers who may perform
services for more than one employer during a given period and do not participate in the NSP-Minnesota and NSP-Wisconsin
sponsored pension and postretirement health care plans. Contributing to these types of plans creates risk that differs from
providing benefits under NSP-Minnesota and NSP-Wisconsin sponsored plans, in that if another participating employer ceases to
contribute to a multiemployer plan, additional unfunded obligations may need to be funded over time by remaining participating
employers.