Xcel Energy 2012 Annual Report Download - page 36
Download and view the complete annual report
Please find page 36 of the 2012 Xcel Energy annual report below. You can navigate through the pages in the report by either clicking on the pages listed below, or by using the keyword search tool below to find specific information within the annual report.-
 1
1 -
2
-
3
-
4
-
5
-
6
-
7
-
8
-
9
-
10
-
11
-
12
-
13
-
14
-
15
-
16
-
17
-
18
-
19
-
20
-
21
-
22
-
23
-
24
-
25
-
 26
26 -
 27
27 -
 28
28 -
 29
29 -
 30
30 -
 31
31 -
 32
32 -
 33
33 -
 34
34 -
 35
35 -
 36
36 -
 37
37 -
 38
38 -
 39
39 -
 40
40 -
 41
41 -
 42
42 -
 43
43 -
 44
44 -
 45
45 -
 46
46 -
47
-
48
-
49
-
50
-
51
-
52
-
53
-
54
-
55
-
56
-
57
-
58
-
59
-
60
-
61
-
62
-
63
-
64
-
65
-
66
-
67
-
68
-
69
-
70
-
71
-
72
-
73
-
74
-
75
-
76
-
77
-
78
-
79
-
80
-
81
-
82
-
83
-
84
-
85
-
86
-
87
-
88
-
89
-
90
-
91
-
92
-
93
-
94
-
95
-
96
-
97
-
98
-
99
-
100
-
101
-
102
-
103
-
104
-
105
-
106
-
107
-
108
-
109
-
110
-
111
-
112
-
113
-
114
-
115
-
116
-
117
-
118
-
119
-
120
-
121
-
122
-
123
-
124
-
125
-
126
-
127
-
128
-
129
-
130
-
131
-
132
-
133
-
134
-
135
-
136
-
137
-
138
-
139
-
140
-
141
-
142
-
143
-
144
-
145
-
146
-
147
-
148
-
149
-
150
-
151
-
152
-
153
-
154
-
155
-
156
-
157
-
158
-
159
-
160
-
161
-
162
-
163
-
164
-
165
-
166
-
167
-
168
-
169
-
170
-
171
-
172
 |
 |

26
In its Order 1000 compliance filing in October 2012, MISO proposed that all future reliability projects be fully allocated to the zones
in which the project is located (rather than allocating costs more broadly) while MVP projects would continue to be eligible for
regional cost allocation. FERC action is anticipated in 2013. The NSP System has certain new transmission facilities for which other
customers in MISO contribute to cost recovery. Likewise, the NSP System also pays a share of the costs of projects constructed by
other transmission owning entities. The transmission revenues received by the NSP System from MISO, and the transmission
charges paid to MISO, associated with projects subject to regional cost allocation could be significant in future periods.
RSG Charges — The MISO tariff charges certain market participants a real-time RSG charge, which is designed to ensure that any
generator scheduled or dispatched by MISO will receive no less than its offer price for start-up, no-load and incremental energy. In
August 2010, the FERC issued two orders relating to RSG charge exemptions and the allocation of the RSG costs among MISO
participants. In recent RSG filings, MISO has proposed, and the FERC has accepted, allocating a greater portion of the RSG costs
related to resources committed for voltage and local reliability requirements to the market participants with the loads that benefit
from such commitments. NSP-Minnesota is permitted to recover the RSG costs through FCA mechanisms approved by the
regulators in each jurisdiction. Certain of the FERC’s orders remain pending on rehearing, and appeals of the FERC orders to the
U.S. Court of Appeals for the D.C. Circuit have been held in abeyance, pending the FERC’s disposition of rehearing requests.
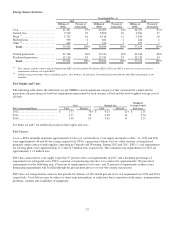
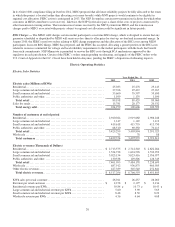
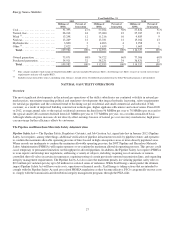
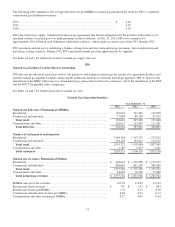
Electric Operating Statistics
Electric Sales Statistics
Year Ended Dec. 31
2012
2011
2010
Electric sales (Millions of KWh)
Residential ...............................................................
25,033
25,278
25,143
Large commercial and industrial ...........................................
27,396
27,419
27,167
Small commercial and industrial ...........................................
35,660
35,597
35,650
Public authorities and other................................................
1,109
1,135
1,100
Total retail ............................................................
89,198
89,429
89,060
Sales for resale ...........................................................
15,781
20,177
20,532
Total energy sold ......................................................
104,979
109,606
109,592
Number of customers at end of period
Residential ...............................................................
2,940,024
2,919,660
2,906,248
Large commercial and industrial ...........................................
1,147
1,129
1,112
Small commercial and industrial ...........................................
419,618
415,755
413,750
Public authorities and other................................................
68,510
69,350
70,413
Total retail ............................................................
3,429,299
3,405,894
3,391,523
Wholesale ...............................................................
75
78
88
Total customers .......................................................
3,429,374
3,405,972
3,391,611
Electric revenues (Thousands of Dollars)
Residential ............................................................... $
2,713,575
$
2,712,340
$
2,622,284
Large commercial and industrial ...........................................
1,534,728
1,616,596
1,533,993
Small commercial and industrial ...........................................
3,023,154
3,025,416
2,956,077
Public authorities and other................................................
130,538
129,826
126,345
Total retail ............................................................
7,401,995
7,484,178
7,238,699
Wholesale ...............................................................
687,912
936,875
960,505
Other electric revenues....................................................
427,389
345,540
252,641
Total electric revenues................................................. $
8,517,296
$
8,766,593
$
8,451,845
KWh sales per retail customer .............................................
26,011
26,257
26,260
Revenue per retail customer ............................................... $
2,158
$
2,197
$
2,134
Residential revenue per KWh..............................................
10.84
¢
10.73
¢
10.43
¢
Large commercial and industrial revenue per KWh ..........................
5.60
5.90
5.65
Small commercial and industrial revenue per KWh ..........................
8.48
8.50
8.29
Wholesale revenue per KWh ..............................................
4.36
4.64
4.68