Xcel Energy 2012 Annual Report Download - page 57
Download and view the complete annual report
Please find page 57 of the 2012 Xcel Energy annual report below. You can navigate through the pages in the report by either clicking on the pages listed below, or by using the keyword search tool below to find specific information within the annual report.-
 1
1 -
2
-
3
-
4
-
5
-
6
-
7
-
8
-
9
-
10
-
11
-
12
-
13
-
14
-
15
-
16
-
17
-
18
-
19
-
20
-
21
-
22
-
23
-
24
-
25
-
26
-
27
-
28
-
29
-
30
-
31
-
32
-
33
-
34
-
35
-
36
-
37
-
38
-
39
-
40
-
41
-
42
-
43
-
44
-
45
-
46
-
 47
47 -
 48
48 -
 49
49 -
 50
50 -
 51
51 -
 52
52 -
 53
53 -
 54
54 -
 55
55 -
 56
56 -
 57
57 -
 58
58 -
 59
59 -
 60
60 -
 61
61 -
 62
62 -
 63
63 -
 64
64 -
 65
65 -
 66
66 -
 67
67 -
68
-
69
-
70
-
71
-
72
-
73
-
74
-
75
-
76
-
77
-
78
-
79
-
80
-
81
-
82
-
83
-
84
-
85
-
86
-
87
-
88
-
89
-
90
-
91
-
92
-
93
-
94
-
95
-
96
-
97
-
98
-
99
-
100
-
101
-
102
-
103
-
104
-
105
-
106
-
107
-
108
-
109
-
110
-
111
-
112
-
113
-
114
-
115
-
116
-
117
-
118
-
119
-
120
-
121
-
122
-
123
-
124
-
125
-
126
-
127
-
128
-
129
-
130
-
131
-
132
-
133
-
134
-
135
-
136
-
137
-
138
-
139
-
140
-
141
-
142
-
143
-
144
-
145
-
146
-
147
-
148
-
149
-
150
-
151
-
152
-
153
-
154
-
155
-
156
-
157
-
158
-
159
-
160
-
161
-
162
-
163
-
164
-
165
-
166
-
167
-
168
-
169
-
170
-
171
-
172
 |
 |

47
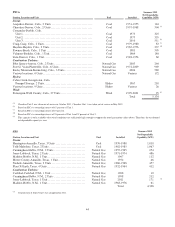
UNREGISTERED SALES OF EQUITY SECURITIES AND USE OF PROCEEDS
Purchases of Equity Securities by the Issuer and Affiliated Purchasers
The following table provides information about our purchases of equity securities that are registered by Xcel Energy Inc. pursuant
to Section 12 of the Exchange Act for the year ended Dec. 31, 2012:
Issuer Purchases of Equity Securities
Period
Total Number
of Shares
Purchased
Average Price
Paid per
Share
Total Number of
Shares Purchased
as Part of Publicly
Announced Plans or
Programs
Maximum Number
(or Approximate
Dollar Value) of
Shares
That May Yet
Be Purchased Under
the Plans or
Programs
Jan. 1, 2012 — Jan. 31, 2012 (a) .........................
17,487
$
26.69
-
-
Feb. 1, 2012 — Feb. 29, 2012 ..........................
-
-
-
-
March 1, 2012 — March 31, 2012 (b) ....................
700,000
26.42
-
-
April 1, 2012 — Dec. 31, 2012 .........................
-
-
-
-
Total ...............................................
717,487
-
-
(a) Xcel Energy Inc. or one of its agents periodically purchases common shares in order to satisfy obligations under the Stock Equivalent Plan for Non-
Employee Directors.
(b) The Xcel Energy Inc. Board of Directors approved the repurchase of up to 700,000 shares of common stock for the issuance of shares in connection with the
vesting of awards under the Xcel Energy Inc. 2005 Long-Term Incentive Plan. Purchases were authorized to be made in the open market pursuant to Rule
10b-18.
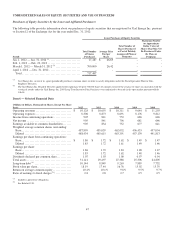
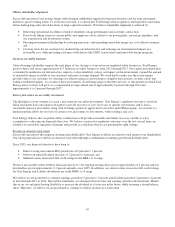
Item 6 — Selected Financial Data
(Millions of Dollars, Thousands of Shares, Except Per Share
Data)
2012
2011
2010
2009
2008
Operating revenues .............................
$
10,128
$
10,655 $
10,311
$
9,644
$
11,203
Operating expenses .............................
8,306
8,873
8,691
8,176
9,812
Income from continuing operations ..............
905
841
752
686
646
Net income ....................................
905
841
756
681
646
Earnings available to common shareholders.......
905
834
752
677
641
Weighted average common shares outstanding:
Basic ........................................
487,899
485,039
462,052
456,433
437,054
Diluted ......................................
488,434
485,615
463,391
457,139
441,813
Earnings per share from continuing operations:
Basic ........................................
$
1.86
$
1.72 $
1.62
$
1.49
$
1.47
Diluted ......................................
1.85
1.72
1.61
1.49
1.46
Earnings per share:
Basic ........................................
1.86
1.72
1.63
1.48
1.47
Diluted ......................................
1.85
1.72
1.62
1.48
1.46
Dividends declared per common share............
1.07
1.03
1.00
0.97
0.94
Total assets ....................................
31,141
29,497
27,388
25,306
24,805
Long-term debt (a) ..............................
10,144
8,849
9,263
7,889
7,732
Book value per share............................
18.19
17.44
16.76
15.92
15.35
Return on average common equity ...............
10.4
%
10.1
%
9.8
%
9.5
%
9.7
%
Ratio of earnings to fixed charges (b)..............
2.8
2.8
2.7
2.5
2.5
(a) Includes capital lease obligations.
(b) See Exhibit 12.01.